
Figures & data
Table 1. Baseline characteristics of 14 patients who received radium-223 (Ra-223) and four patients on placebo treatment.
Table 2. Number of patients that received Ra-223 with changes of PSA, total-ALP and bone-ALP from baseline after three- and six months treatment.
Figure 1. Longitudinal changes (% from baseline, 0) of prostate-specific antigen (PSA), total alkaline phosphatase (total ALP) and bone alkaline phosphatase (bone ALP) during 6 months of therapy with radium-223 (Ra-223) (A: 14 patients) or placebo (B: four patients). (Several parts of individual curves overlap each other.) Dashed horizontal line indicates ≥30% increase from baseline; solid horizontal line indicates ≥30% reduction from baseline.
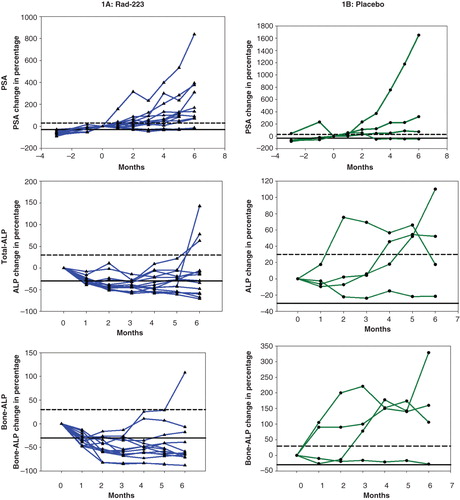
Table 3. Six month changes on [99mTc]bisphosphonate bone scan.
Figure 2. Whole-body [99mTc]bisphosphonates (HDP) bone scans for patient no. 13: pretreatment (left column A and C) and post-treatment (right column B and D), with anterior views (upper row A and B) and posterior views (lower row C and D). Development of new/expansion of existing lesions (n = 24) and concomitant reduced HDP uptake in pretreatment known lesions. Arrows point to C2 and Th7, further visualized by FACBC positron emission tomography/computed tomography; this examination was not available for the left thigh (broken arrow).
![Figure 2. Whole-body [99mTc]bisphosphonates (HDP) bone scans for patient no. 13: pretreatment (left column A and C) and post-treatment (right column B and D), with anterior views (upper row A and B) and posterior views (lower row C and D). Development of new/expansion of existing lesions (n = 24) and concomitant reduced HDP uptake in pretreatment known lesions. Arrows point to C2 and Th7, further visualized by FACBC positron emission tomography/computed tomography; this examination was not available for the left thigh (broken arrow).](/cms/asset/fb240459-764c-44eb-8cc9-69cc326150b1/isju_a_982169_f0002_c.jpg)
Figure 3. [18F]FACBC positron emission tomography/computed tomography fused images of C2 (upper row) and Th7 (lower row) for patient no. 13: pretreatment (left column) and post-treatment (right column). Tumour expansion with increased FACBC uptake (arrows) in areas of no/very weak uptake pretreatment, interpreted as new tumour tissue.
![Figure 3. [18F]FACBC positron emission tomography/computed tomography fused images of C2 (upper row) and Th7 (lower row) for patient no. 13: pretreatment (left column) and post-treatment (right column). Tumour expansion with increased FACBC uptake (arrows) in areas of no/very weak uptake pretreatment, interpreted as new tumour tissue.](/cms/asset/c249f32d-35c4-40c1-a75e-d4d628a5506b/isju_a_982169_f0003_c.jpg)