Figures & data


Figure 1. Effect of TPGS on the solubility of sirolimus.
Table I. TPGS CMC and sirolimus Sfree and Ka in the TPGS-sirolimus system.
Figure 2. Effect of TPGS on the stability of sirolimus.
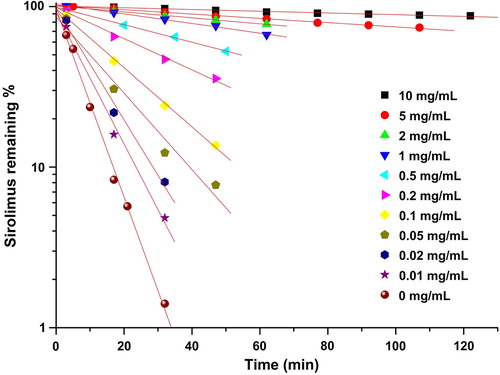
Figure 3. The pseudo-first-order degradation constant of sirolimus in a dissolution medium with a pH of 1.2.
Table II. The effect of the TPGS concentration on the stability of sirolimus in a dissolution medium with a pH of 1.2.

Figure 4. Representative Lineweaver–Burk plots for the degradation of sirolimus in a dissolution medium with a pH of 1.2.
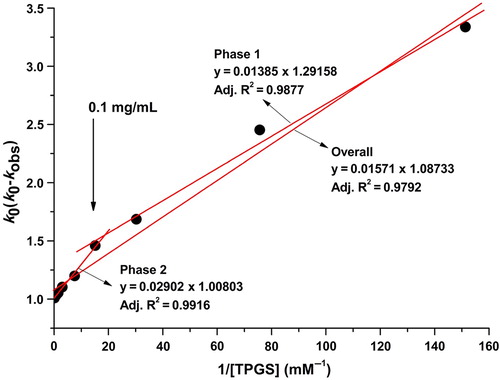
Table III. The k0, kc and Kc values calculated using the Lineweaver–Burk plots for the TPGS-sirolimus system.
Figure 5. Particle size distributions of empty TPGS micelles (a) and sirolimus-loaded TPGS micelles (b).
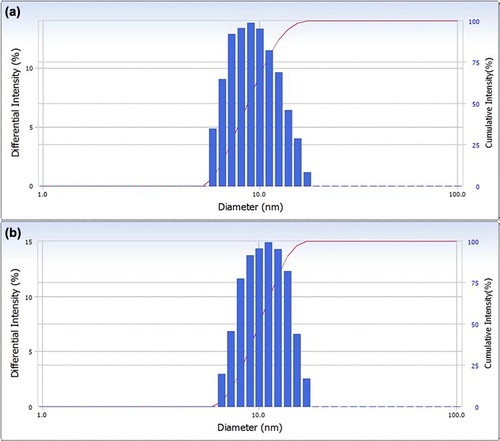
Table IV. Pharmacokinetic parameters of sirolimus in rats after the oral administration of raw sirolimus and sirolimus-loaded TPGS micelles.
Figure 6. Blood concentration–time profile of sirolimus in rats after the oral administration of raw sirolimus and sirolimus-loaded TPGS micelles.