Figures & data
Figure 1. Schematic representation of Poly(ethylene glycol)-poly(lactic acid) block-copolymer encapsulated Polystroma-free hemoglobin-superoxide dismutase-catalase-carbonic anhydrase (PEG-PLA-Poly SFHb-SOD-CAT-CA) nanocapsules.
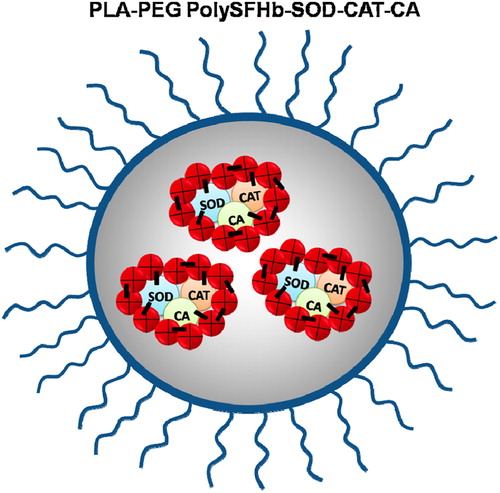
Figure 2. Synthesis and characterizations of PLA-PEG (a) Chemical reaction equation to synthesize PLA-PEG: the –COOH in DL-PLA reacted with –OH in mPEG, dehydrating into PLA-PEG. (b) FTIR spectra of mPEG, PLA and PLA-PEG. 0.25 mg of the dry sample was mixed with IR-grade KBr (0.1 g) and pressed (10 ton) into tablet form. The spectrum of the tablet was then recorded by an FTIR spectrometer.
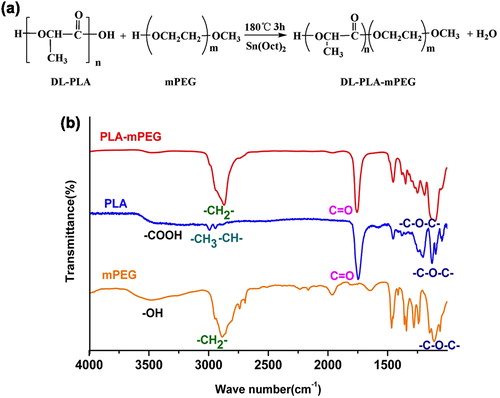
Figure 3. TEM pictures without metal spraying of PLA-PEG-PolyHb nanoparticles, PLA-PEG-PolySFHb nanoparticles, and PLA-PEG-PolySFHb-SOD-CAT-CA nanoparticles.
Figure 7. Muscle PCO2 of a lethal hemorrhagic shock and resuscitation for each of the four groups.
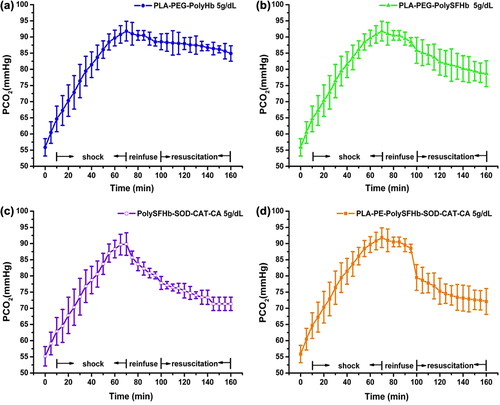
Figure 8. Combined figure of PCO2: There were no significant differences between the PolySFHb-SOD-CAT-CA group (—□—) and the PLA-PEG-PolySFHb-SOD-CAT-CA group (—■—) in terms of PCO2 at any time of resuscitation, and they had the lower PCO2 than the other two groups. PLA-PEG-PolyHb group (—•—) had higher PCO2 after 20 mins of resuscitation than PLA-PEG-PolySFHb group (—▲—). (n = 6, P < 0.05).
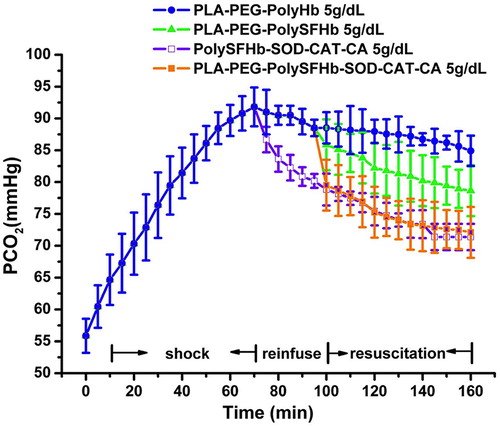
Figure 4. The concentrations of Hb and enzymes activities in PLA-PEG-PolyHb nanoparticles, PLA-PEG-PolySFHb nanoparticles, PolySFHb-SOD-CAT-CA, and PLA-PEG-PolySFHb-SOD-CAT-CA nanoparticles.
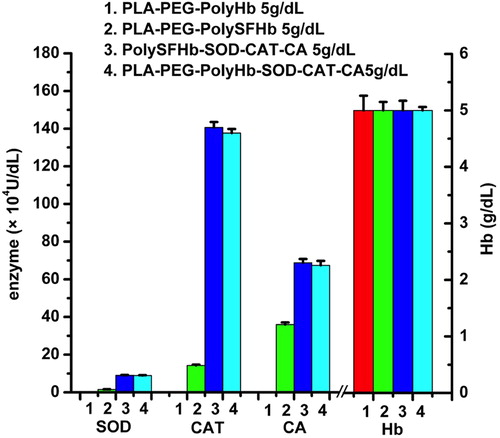
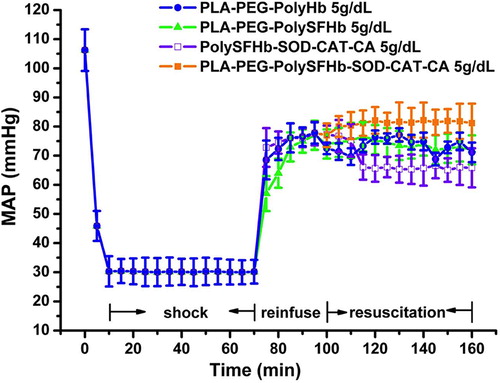
Figure 5. MAP of lethal hemorrhagic shock and resuscitation for each of the four groups.
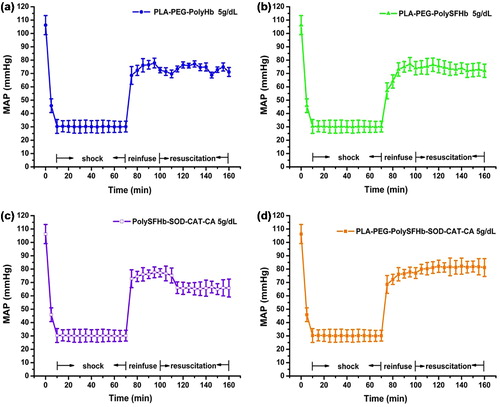
Figure 6. Combined figure of MAP: There were no significant differences between the MAP in PLA-PEG-PolySFHb group (—▲—) and PLA-PEG-PolyHb group (—•—). PLA-PEG-PolySFHb-SOD-CAT-CA group (—■—) had significantly highest MAP in all groups at any time of resuscitation, PolySFHb-SOD-CAT-CA group (—□—) had significantly lowest MAP in all groups after 15 min of resuscitation (n = 6, P < 0.05).