513
Views
1
CrossRef citations to date
0
Altmetric
Original Articles

Simulation and verification of macroscopic isotropy of hollow alginate-based microfibers

, , , , &
Pages 390-397 | Received 19 Dec 2013, Accepted 19 Feb 2014, Published online: 01 Apr 2014

Figures & data

Figure 1. (A) Solid alginate microfiber configuration at 4X (OD = 1.3 mm); (B) hollow alginate microfiber at 10X (OD = 530 μm, ID = 300 μm, t = 115 μm, and L = 3.5 cm). Measurement analysis performed by NIS-Elements v.3.2.2 software using a Nikon Eclipse Ti-S transmission microscope with Interline CCD camera (Andor Technology). With Permissions from Global Life Sciences reproduced from [CitationDjomehri et al. 2013].
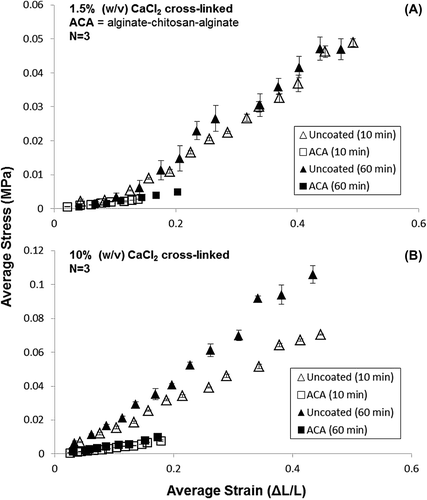
Figure 2. Stress-strain curve for 2% (w/v) alginate hollow microfibers cross-linked for 10 min and 60 min in (A) 1.5% (w/v) CaCl2 and (B) 10% (w/v) CaCl2. Microfiber membranes were fabricated with two conditions; uncoated or coated (alginate-chitosan-alginate). Deviations from the mean reported as SEM (N = 3).
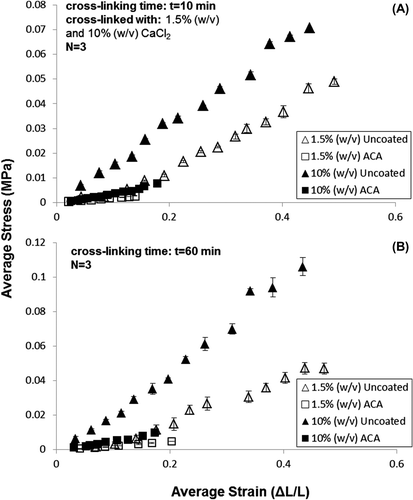
Figure 3. Stress-strain curve for 2% (w/v) alginate microfibers, uncoated and ACA (alginate-chitosan-alginate) coated, and cross-linked for (A) 10 min and (B) 60 min. Microfibers were cross-linked with either 1.5% (w/v) or 10% (w/v) CaCl2. Deviations from the mean reported as SEM (N = 3).

Table I. Composition and geometric specification of uncoated and Alginate–Chitosan–Alginate (ACA) hollow microfibers.

Table II. Comparison of measured, simulated, and calculated mechanical properties.
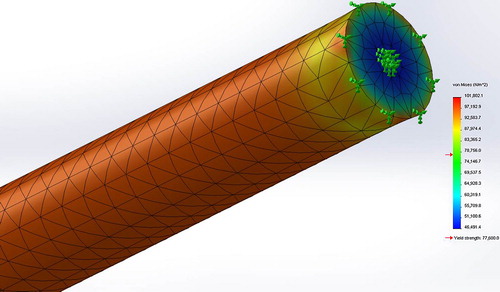
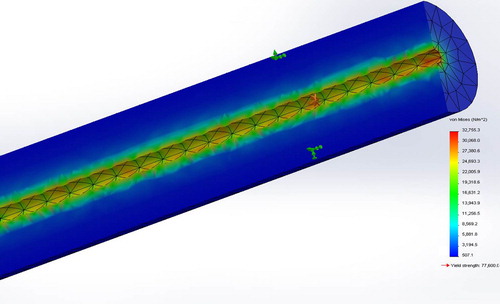
Figure 4. Meshed model of Von Mises stress distribution at maximum extension for the strongest stent (2% bare, 10% CaCl2, 60 min, Sample ID#4), constrained at both ends simulating the experimental setup. On the stent's surface, the simulated value of the maximum von Mises stress or UTS is 101 or N/m2 kPa. Also shown is the Yield strength of 77.6 kPa a formulation-specific software input based on the experimental value of UTS.
Figure 5. Section view of the meshed model of Von Mises stress distribution and core deformation for the strongest stent (2% bare, 10% CaCl2, 60 min, Sample ID#4) subjected to simulated circumferential constraint in a blood vessel and a hypertensive systolic pressure loading of 20 kPa. The value of the maximum von Mises stress or UTS is 37.8 kPa. Also shown is the Yield strength of 77.6 kPa a formulation-specific software input based on the experimental value of UTS.
Figure 6. Correlation plot between experimental and simulated elongation at break values in the radial (A) and (B) longitudinal directions and respective coefficients of determination (R2) based on linear fits.

Reprints and Corporate Permissions

Please note: Selecting permissions does not provide access to the full text of the article, please see our help page How do I view content?

To request a reprint or corporate permissions for this article, please click on the relevant link below:

Academic Permissions

Please note: Selecting permissions does not provide access to the full text of the article, please see our help page How do I view content?

Obtain permissions instantly via Rightslink by clicking on the button below:

If you are unable to obtain permissions via Rightslink, please complete and submit this Permissions form. For more information, please visit our Permissions help page.