Figures & data
Figure 1. The effect of daily gavage of microencapsulated live L. acidophilus cells in 2% (milk fat) M.F. yogurt to ApcMin mice on animal body weights: normal distribution of body weights for each animal (A); Histograms representing weekly animal body weight distribution (weeks:1–12,15–17, n = sample size, b = bin (g)); size selected so the histogram of the simulated Gaussian function exhibits the expected normal distribution (B). Data represent the mean ± SEM per group; n = 24.
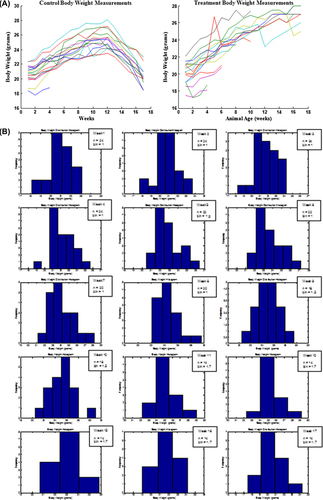
Table I. Enumeration, classification (A) and scoring (B) of tumors in ApcMin mice.
Figure 2. Histological evaluation: intestinal changes in the small intestines of ApcMin mice; (A) Multiple lesions found in control group animal, arrows point to high- (control group) and low-grade (treatment group) adenomas; note: magnified tumor shows features resembling adenocarcinoma, with the initiation of cribriform pattern features (top arrow); Diagnosis of possible adenocarcinoma was based on cellular and nuclear pleiomorphism and loss of cell polarity. Architectural abnormalities such as the presence of intraglandular papillary projections and cribriform and solid areas were also present; the presence of flat destructed villi and intestinal glands was also observed throughout analysis of individual samples of animals from control group. (B) Microadenomas found in treatment group animal; note: the unobstructed intestinal lumen and well-defined, healthy microvilli composed of columnar epithelial cells. Magnification: 4× (left), 20× (right). All tissues were stained with hematoxylin and eosin.
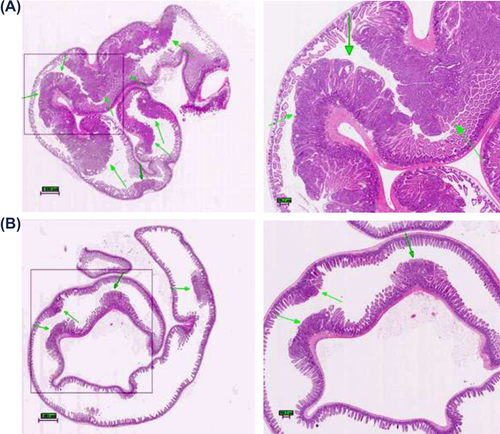
Figure 3. Histological evaluation: pathological changes in the large intestines of ApcMin mice; (A) a representative tumor found in an animal from the control group displaying features of an invasive adenoma protruding into intestinal lumen. Note: absence of Lieberkühn crypts around the adenoma. (B) a representative large intestine obtained from animal of treatment group showing completely unobstructed lumen and the absence of polyps; Original magnification: 4×. All tissues were stained with hematoxylin and eosin.
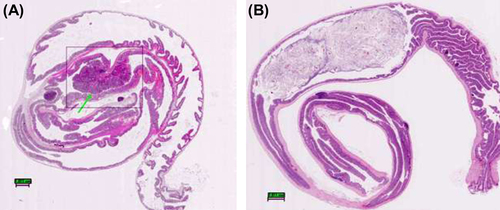
Figure 4. Determination of apoptotic cells in lamina propria of the small intestine of ApcMin mice using In Situ Apoptotic Cell Labeling Method (TUNEL); (A) Slide showing a tumor found in the animal from control group, note presence of apoptotic cells primarily at the surface of the tumor, a localization of the oldest cells; magnification 40× (B) slide showing healthy microvilli found in the representative animal of treatment group, apoptotic cells are found throughout the entire length of the villi, at the base, along the crypts and at the surface, magnification 40×.
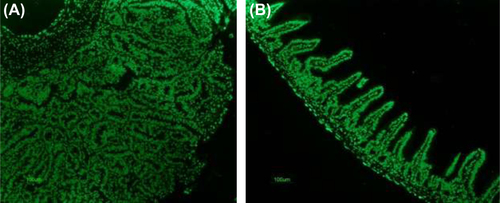
Figure 5. MatLab processing and quantification of the biomarkers; (A) representative photograph showing processed image; (B) the percent expression of CD8, Mac-1, cleaved caspase-3, and Ki-67 expressing cells in control and treatment group animals; asterisks, statistical differences (p < 0.05) when compared to control.
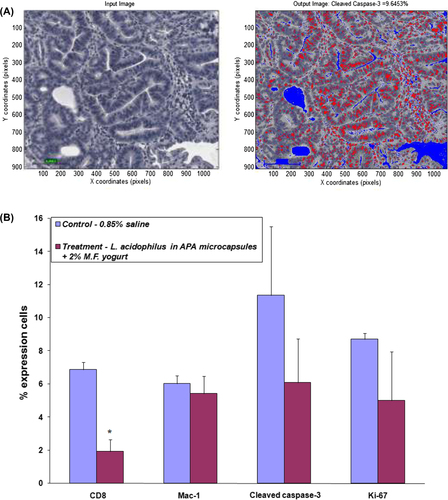
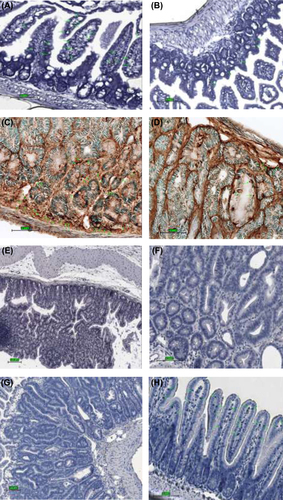
Figure 6. Immunohistochemical staining for CD8, Mac-1, cleaved caspase-3, and Ki-67 expressing cells in the small intestinal tissue from representative animals; control animal (left) and treatment animal (right). (A) higher abundance of positive CD8 cells in control group animal; magnification 40× (B) localization of CD8 cells within and around a tumorous overgrowth; magnification 40× (C) expression of Mac-1 cells in a control group animal; magnification 40× (D) scarce positive Mac-1 cells detected in treatment group animal; magnification 40× (E) staining for cleaved caspase-3: high expression of apoptotic cells in the area of the tumor with greater concentration found at the surface; magnification 20× (F) lower expression of cleaved caspase-3 cells in normal mucosa; magnification 40× (G) proliferation cells marker Ki-67 greatly present in adenoma of control group animal; magnification 20× (H) fewer Ki-67 positive cells seen within microvilli of the small intestine of the treatment group animal, see pointing arrows; magnification 20×.