582
Views
2
CrossRef citations to date
0
Altmetric
ORIGINAL ARTICLE

Preparation and evaluation of multifunctional envelope-type nano device loading siRNA

, , , , , & show all
Pages 20-26 | Received 30 Dec 2013, Accepted 26 Mar 2014, Published online: 16 May 2014

Figures & data

Figure 1. Gel retardation assay of siRNA/PLL complex. Lane 1, naked siRNA; Lane 2, PLL; Lane 3, ˜11 mass ratio of PLL to siRNA was 1, 3, 5, 8, 10, 15, 30, 40, and 50 respectively.
Figure 2. Diagram of liner relation between FAM-siRNA concentration and fluorescence intensity.

Table I. Factors and levels of orthogonal tests.

Table II. Arrangement and results of orthogonal tests according to L9(34).

Figure 3. Trends of levels in every factor. A, B, C, D means 4 factors and 1, 2, 3 means 3 levels.
Figure 4. Shapes of MEND through TEM.
Figure 5. The size distribution and zeta potential distribution of MEND. (A) size distribution of MEND (CHEMS), (B) size distribution of MEND (PLL), (C) zeta potential distribution of MEND (CHEMS), (D) zeta potential distribution of MEND (PLL).

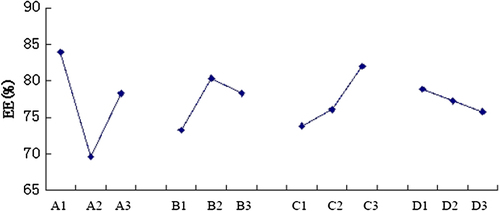
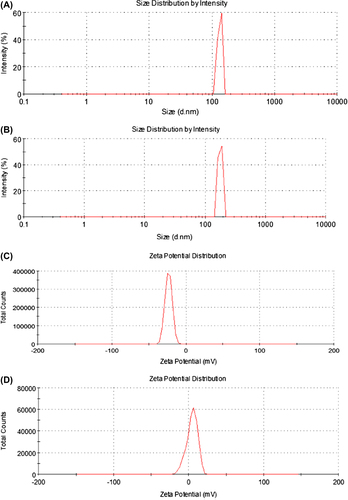
Table III. Particle size and of zeta potential MEND.

Figure 6. SiRNA serum stability experiments. Lane 1, Marker; Lane 2, pure siRNA; Lane 3, siRNA-PLL; Lane 4, siRNA in MEND.
Figure 7. Results of cell transfection. (A) MEND (PLL) at a concentration of 500 nM FAM-siRNA, (B) MEND (PLL) at a concentration of 250 nM FAM-siRNA, (C) pure FAM-siRNA at a concentration of 500 nM, (D) pure FAM-siRNA at a concentration of 500 nM.

Reprints and Corporate Permissions

Please note: Selecting permissions does not provide access to the full text of the article, please see our help page How do I view content?

To request a reprint or corporate permissions for this article, please click on the relevant link below:

Academic Permissions

Please note: Selecting permissions does not provide access to the full text of the article, please see our help page How do I view content?

Obtain permissions instantly via Rightslink by clicking on the button below:

If you are unable to obtain permissions via Rightslink, please complete and submit this Permissions form. For more information, please visit our Permissions help page.