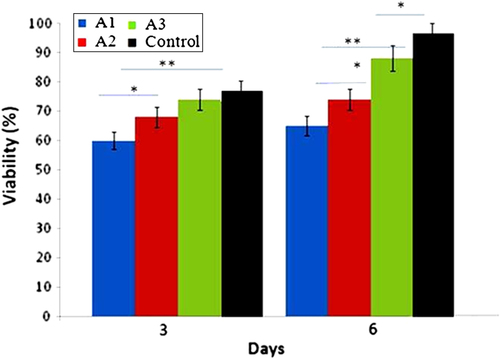
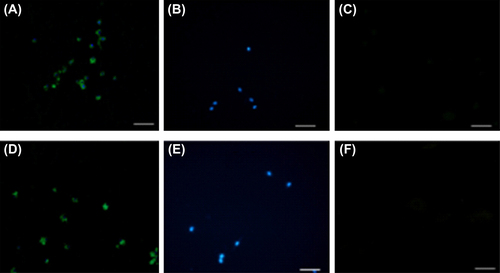
1,269
Views
24
CrossRef citations to date
0
Altmetric
ORIGINAL ARTICLE

Synthesis of calcium phosphate-zirconia scaffold and human endometrial adult stem cells for bone tissue engineering

, , , , , , , , & show all
Pages 66-73 | Received 05 Mar 2014, Accepted 26 Mar 2014, Published online: 08 May 2014

Figures & data

Figure 1. Designed ZrO2/β-TCP scaffolds with different ratios.
Figure 2. XRD analyses for the scaffolds with different ratios.
Figure 3. SEM image of the samples with different ratios of ZrO2.Y2O3/β-TCP. A1: 50/50, A2: 40/60, and A3: 30/70.
Figure 4. SEM image of the cross section of the bridges for samples with different ratios of ZrO2.Y2O3/β-TCP. A1: 50/50, A2: 40/60, and A3: 30/70.
Figure 5. EDAX image of distribution of zirconium and calcium from ZrO2.Y2O3/β-TCP in the samples with different ratios of ZrO2.Y2O3/β-TCP. A1: 50/50, A2: 40/60, and A3: 30/70.
Figure 6. The porosity and density diagram for samples with different ratios of ZrO2.Y2O3/β-TCP. A1: 50/50, A2: 40/60, and A3: 30/70.
Figure 7. The stress-strain curves for samples with different ratios of ZrO2.Y2O3/β-TCP. A1: 50/50, A2: 40/60, and A3: 30/70.
Figure 8. Flow cytometric analysis of isolated EnSC for mesenchymal stem cell markers (CD90, CD105, and CD44), haemopoietic marker (CD34 and CD133), endothelial marker (CD31) and ES cell marker (OCT4). As shown the isolated cells are positive for CD90, CD105, CD44, and OCT4 and are negative for CD31, CD34.
Figure 9. Osteogenic capacity under in vitro condition (A, B), immunocytochemistry for osteocyte special marker osteopontin (C) and osteocalsin (D) [Scale bar: 100 μm], evaluation of gene expression of critical genes (SPP1, ALP, SPARC) for osteoconductivity by Real time PCR in 3D culture condition (E).
Figure 10. MTT result after 3 and 6 days co-culture ESC and ZrO2/β-TCP composite. Y2O3/β-TCP in the samples with different ratios of ZrO2.Y2O3/β-TCP. A1: 50/50, A2: 40/60, and A3: 30/70.
Figure 11. Immunocytochemistry for the expression of osteoblast markers, 6 days after the implantation of differentiated cells on the scaffolds. Osteopontin (A: osteopontin specificity marker, B: 4,6-diamidino-2-phenylindole dihydrochloride, and C: negative control) and osteocalsin (D: osteocalcin specificity marker, E: 4,6-diamidino-2-phenylindole dihydrochloride, and F: negative control); Scale bar: 100 μm.
Figure 12. SEM images of the culture ESC on ZrO2/β-TCP composite (Y2O3/β-TCP: 30/70) in different magnifications (A: 250X, B: 500X, C: 1000X, and D: 5000X).

Reprints and Corporate Permissions

Please note: Selecting permissions does not provide access to the full text of the article, please see our help page How do I view content?

To request a reprint or corporate permissions for this article, please click on the relevant link below:

Academic Permissions

Please note: Selecting permissions does not provide access to the full text of the article, please see our help page How do I view content?

Obtain permissions instantly via Rightslink by clicking on the button below:

If you are unable to obtain permissions via Rightslink, please complete and submit this Permissions form. For more information, please visit our Permissions help page.