Figures & data
Figure 1. Differential scanning calorimetry thermogram of bacterial PHB. Bacterial PHB with a crystallinity ratio of 59.7% and molecular weight of 82.500 g/mol is obtained from A. eutrophus strain.
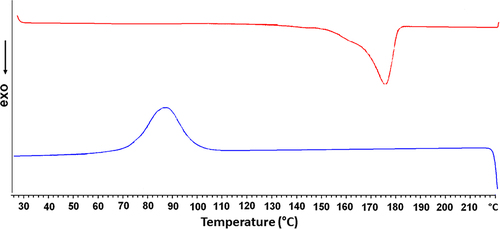
Figure 2. SEM images of the electrospun bacterial PHB nanofiber scaffolds. The insets show higher magnification images of the surfaces. Bacterial PHB nanofiber scaffolds with a diameter of 700 nm to 800 nm are obtained. Scale bars are 30 and 5 μm.
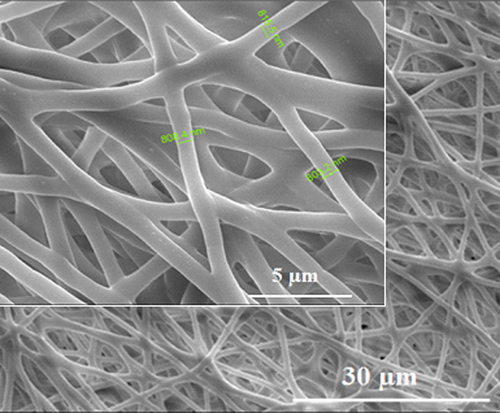
Figure 3. SEM images of synthesized calcium oxalate stones. The insets show higher magnification images of the synthesized calcium oxalate stones. Calcium oxalate stones show crystal morphology. Scale bars are 20 and 200 μm.
Figure 4. FTIR spectrum of the synthetic calcium oxalate stones. According to the obtained FTIR-spectra, the synthetic calcium oxalate stones showed all of the typical bands.
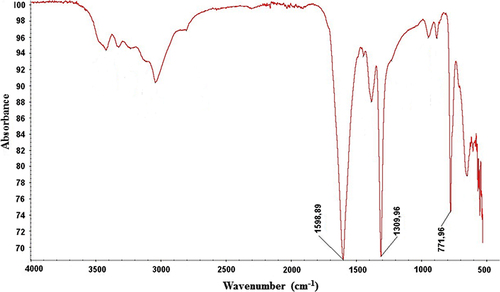
Figure 5. (A) Comparison of water contact angle values for the non-modified and modified PHB scaffolds. (B) Images of the water contact angles for the non-modified, EDA- and PEG-modified scaffolds. EDA and PEG plasma treatment enhanced the wettability of bacterial nanofibrillar PHB scaffolds. Values are mean ± EM; n = 5; *p < 0.005 compared to the non-modified PHB scaffold.
Figure 6. In-vitro degradation of non-modified and modified PHB scaffolds in PBS solution. There is no statistical difference related to degradation rate between groups. Values are mean ± EM; n = 3; statistical significance are marked as *** p > 0.05.
Figure 7. Amounts of deposited calcium on the non-modified, EDA- and PEG-modified nanofibrillar scaffolds. Calcium oxalate deposition decreased on EDA- and PEG-modified PHB scaffolds. Values are mean ± EM; n = 3; statistical significance are marked as * p < 0.005, ** p < 0.05.
Table I. Atomic percentages of C, O, N and Ca elements on the non-modified and modified scaffolds. Calcium oxalate deposition decreased on EDA- and PEG-modified PHB scaffolds.
Figure 8. Calcium oxalate deposition on (A) non-modified, (B) EDA-modified and (C) PEG-modified nanofibrillar PHB scaffolds after 7 days of treatment.
Figure 9. Cell attachment of mouse urinary bladder cells on non-modified and modified PHB scaffolds for 10 days (n = 6). Cellular proliferation increased on EDA- and PEG-modified PHB scaffolds. Statistical significance (p < 0.005) are marked as *.