863
Views
6
CrossRef citations to date
0
Altmetric
ORIGINAL ARTICLE

A novel glutamine biosensor based on zinc oxide nanorod and glutaminase enzyme from Hypocria jecorina

&
Pages 92-97 | Received 13 Mar 2014, Accepted 04 Apr 2014, Published online: 21 May 2014

Figures & data

Figure 1. The Scanning electron microscope image of the ZnO nanorod.
Scheme 1. The preparation scheme of glutamine biosensor based on glutaminase from Hypocria jecorina (
), ZnO nanorod (
), and chitosan (
).
Scheme 1. The preparation scheme of glutamine biosensor based on glutaminase from Hypocria jecorina (Display full size), ZnO nanorod (Display full size), and chitosan (Display full size).
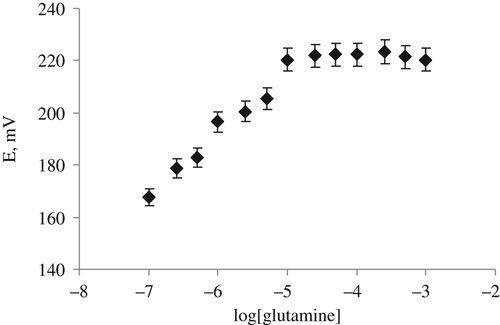
Figure 2. The calibration graphs of the glutamine biosensor. The study is carried out with 1.0 × 10− 5–1.0 × 10− 7 M glutamine calibration solutions in phosphate buffer (pH 7.4).
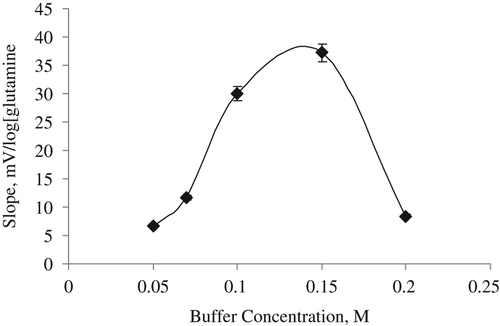
Figure 3. Effect of buffer concentration on the glutamine biosensor. The study is carried out with 1.0 × 10− 5–1.0 × 10− 7 M glutamine calibration solutions in phosphate buffer.
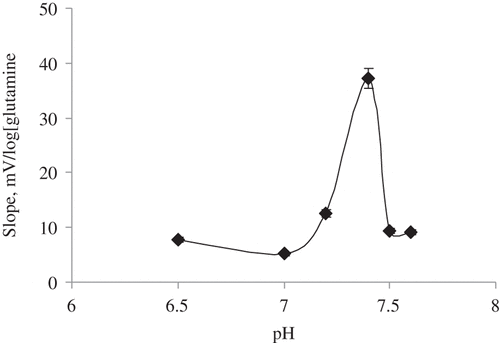
Figure 4. Effect of pH on the glutamine biosensor. The study is carried out with 1.0 × 10− 5–1.0 × 10− 7 M glutamine calibration solutions in 0.15 M phosphate buffer at changing pH values.
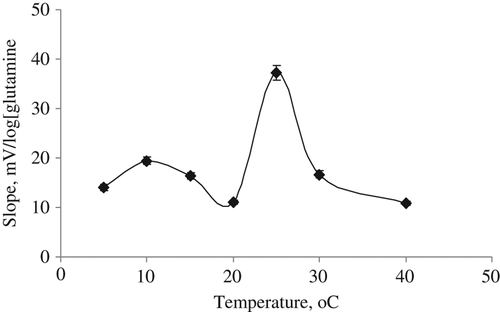
Figure 5. Effect of temperature on the glutamine biosensor. The study is carried out with 1.0 × 10− 5-1.0 × 10− 7 M glutamine calibration solutions in 0.15 M phosphate buffer at pH 7.4.
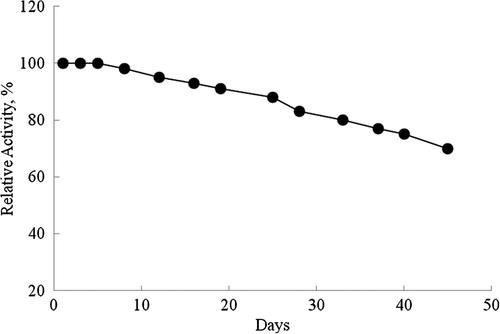
Figure 6. The lifetime of glutamine biosensor for a period of 45 days. The study is carried out with 1.0 × 10− 5–1.0 × 10− 7 M glutamine calibration solutions in 0.15 M phosphate buffer at pH 7.4.
Figure 7. The Lineweaver–Burk plot of glutaminase from Hypocria jecorina immobilized in prepared glutamine biosensor. The measurements were made using our proposed glutamine biosensor.

Table I. The results of glutamine content obtained from the proposed glutamine biosensor and the original value in GNC glutamine powder.

Reprints and Corporate Permissions

Please note: Selecting permissions does not provide access to the full text of the article, please see our help page How do I view content?

To request a reprint or corporate permissions for this article, please click on the relevant link below:

Academic Permissions

Please note: Selecting permissions does not provide access to the full text of the article, please see our help page How do I view content?

Obtain permissions instantly via Rightslink by clicking on the button below:

If you are unable to obtain permissions via Rightslink, please complete and submit this Permissions form. For more information, please visit our Permissions help page.