Figures & data
Table I. Primers used for qRT-PCR.
Figure 1. The morphological appearance of isolated mesenchymal stem cells derived from adipose tissue. (a) Cells begin to adhere to the plastic surface in P0 after 48 h. (b) Cells after 7 days of culture in P0. Bars, 50 μm.
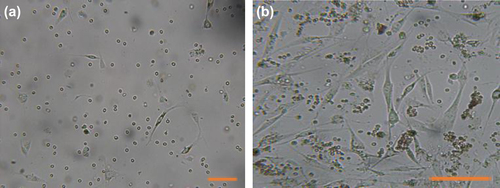
Figure 2. Differentiation potential of AT-MSC. Passage 3 of isolated AT-MSCs (a) Microscopic image views of the differentiation of AT-MSCs into adipogenic (b), osteogenic (c) lineages. Oil red staining shows lipid droplets stained red, deposits of calcium crystals stained red to brown by alizarin red staining (c). Bars, 50 μm.
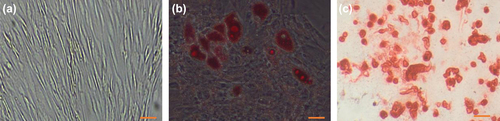
Figure 3. Immunophenotype of isolated AT-MSCs. AT-MSCs were positive for CD44 and CD90, CD73, and CD105, and negative for CD34, CD31, and CD45 that verified their identity.
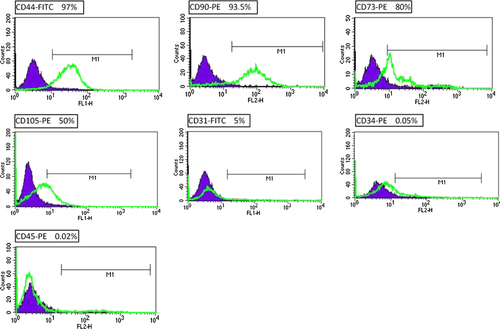
Figure 4. Rapid morphological shift of DMSO-treated groups. The treatments of HGF + DMSO (C) and HGF+ DMSO+ OSM (d) displayed an early conversion of the cellular shape on days 8 and 9, whereas no significant change is obvious on day 8 of HGF treatment (b). (a): control.
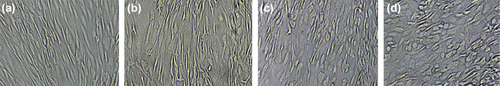
Figure 5. Urea and Albumin detection. Graph (a) the urea production after addition of NH4Cl in different days and different groups showed no significance among treatments. Graph (b) Concentrations of albumin secreted by AT-MSCs (control) HGF treated, HGF+ DMSO, and HGF+ DMSO+ OSM (at day 21); the albumin levels was significantly higher in DMSO-treated groups.
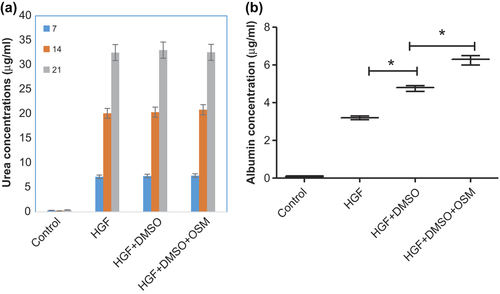
Figure 6. Periodic PAS of control (a), HGF (b), HGF+ DMSO (c), HGF+ DMSO+ OSM (d). representing PAS-positive cells (%) in different groups.
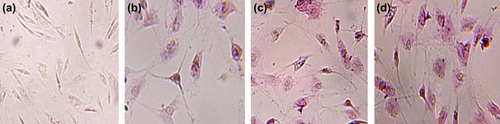
Table II. PAS-positive cells in each groups (%).
Figure 7. The expression of AFP (a), CK-18 (b), and ALB (c) was investigated by qRT-PCR in three differentiation groups on day 21 and control. GAPDH was used as internal standard. Hepatocyte marker genes, ALB and CK-18, are significantly up-regulated in DMSO-treated groups.
Figure 8. Expression of HNF6 (a) and HNF4a (b) treated with HGF, HGF+ DMSO and HGF+ DMSO+ OSM medias for a 21-day period. Genes were quantified and normalized against GAPDH. A significant increase was observed in the levels of both HNF6 and HNF4a in HGF+ DMSO and HGF+ DMSO+ OSM groups as compared with HGF-treated ones (p < 0.0001). Data are represented as the mean + SEM; p < 0.05 was considered significant.