11,586
Views
94
CrossRef citations to date
0
Altmetric
REVIEW

Nanogel—an advanced drug delivery tool: Current and future

, , , , , & show all
Pages 165-177 | Received 11 Apr 2014, Accepted 28 May 2014, Published online: 23 Jul 2014

Figures & data

Table I. Classification of nanogel according to their structure.

Figure 1. Synthesis of nanogels by copolymerization in colloidal environments. Copolymerization of monomers [A] and bifunctional cross-linkers [B] in w/o microemulsions stabilized by surfactants [C] produces nanogels which can be then transferred into aqueous media after removal of surfactants and organic solvent.

Figure 2. Inverse micro emulsion process.

Figure 2. Inverse micro emulsion process.

Figure 3. Aggregation of hydrophobically modified polymer, cholesterol-pullulan, in the presence of insulin molecules results in nanogels containing entrapped protein.

Figure 3. Aggregation of hydrophobically modified polymer, cholesterol-pullulan, in the presence of insulin molecules results in nanogels containing entrapped protein.

Figure 4. Schematic presentation of RAFT process.

Figure 4. Schematic presentation of RAFT process.

Figure 5. Synthesis of nanogels by cross-linking of the preformed polymer chains or self-assembled polymeric aggregates. Cross-linking of double-end activated PEG and PEI chains in o/w emulsion followed by evaporation of the organic solvent.

Figure 5. Synthesis of nanogels by cross-linking of the preformed polymer chains or self-assembled polymeric aggregates. Cross-linking of double-end activated PEG and PEI chains in o/w emulsion followed by evaporation of the organic solvent.

Figure 6. Schematic presentation of emulsion photopolymerisation process.

Figure 6. Schematic presentation of emulsion photopolymerisation process.

Figure 7. Schematic presentation of pullulan glucose unit modifications.

Figure 7. Schematic presentation of pullulan glucose unit modifications.

Figure 8. Drug release due to change in pH.

Figure 8. Drug release due to change in pH.

Figure 9. Drug release due to thermo-volume responsiveness of nanogels.

Figure 9. Drug release due to thermo-volume responsiveness of nanogels.

Figure 10. Drug release from nanogel due to diffusion.

Figure 10. Drug release from nanogel due to diffusion.

Table II. Applications of nanogels in the cancer therapy.

Table III. Applications of nanogels in gene delivery, enzymology, and protein folding.

Table IV. Nanogel applications in gastrointestinal disorder.

Table V. Marketed formulation of nanogel.
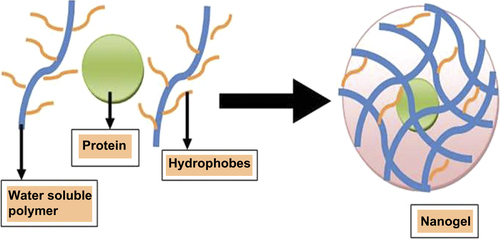
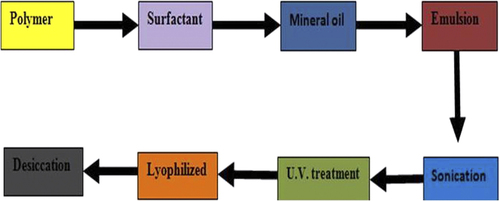
Reprints and Corporate Permissions

Please note: Selecting permissions does not provide access to the full text of the article, please see our help page How do I view content?

To request a reprint or corporate permissions for this article, please click on the relevant link below:

Academic Permissions

Please note: Selecting permissions does not provide access to the full text of the article, please see our help page How do I view content?

Obtain permissions instantly via Rightslink by clicking on the button below:

If you are unable to obtain permissions via Rightslink, please complete and submit this Permissions form. For more information, please visit our Permissions help page.