1,196
Views
24
CrossRef citations to date
0
Altmetric
ORIGINAL ARTICLE

Gene silencing effect of SiRNA-magnetic modified with biodegradable copolymer nanoparticles on hTERT gene expression in lung cancer cell line

, , , , &
Pages 188-193 | Received 14 May 2014, Accepted 10 Jun 2014, Published online: 14 Jul 2014

Figures & data

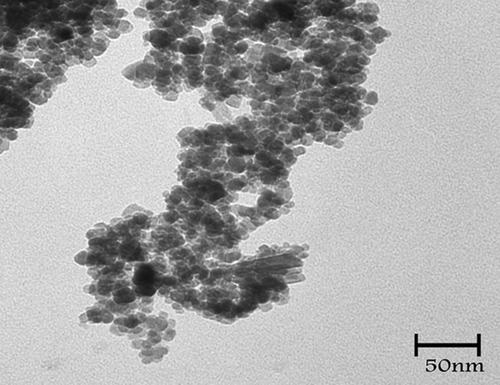
Figure 1. Superparamagnetic nanoparticles prepared using an improved chemical coprecipitation method, and the TEM image: particle size < 50 nm.
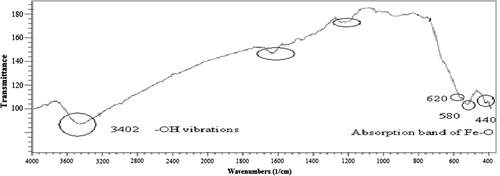
Figure 2. Fourier transform infrared spectra of pure Fe3O4. Absorption peaks at 440, 580, and 620 cm−1 belonging to the stretching vibration mode of Fe–O bonds in Fe3O4, and the peak at 3402 cm−1 belonging to –OH vibrations.
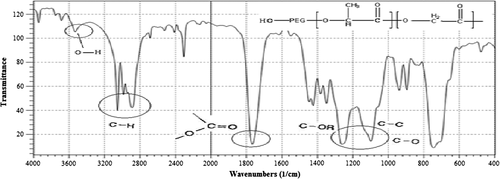
Figure 3. FTIR spectra of the PLGA-PEG diblock copolymers. A strong band at 1762.6 cm−1 is assigned to C=O stretch in lactide and glycolide structure and an absorption band at 3509.9 cm−1 is assigned to terminal hydroxyl groups.
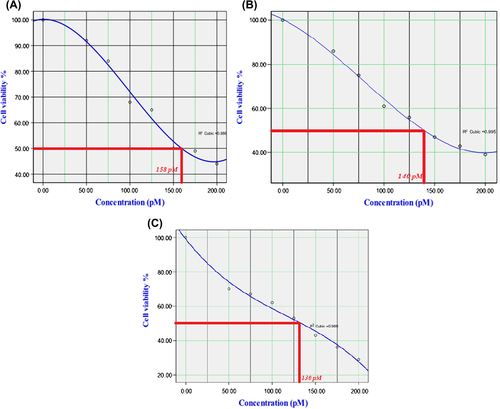
Figure 4. Cytotoxicity determination of different concentrations of encapsulated siRNA on Calu6 cells after 24 h (A), 48 h (B), 72 h (C). The percent of cell viability was reduced with increasing of concentration and half-maximal inhibitory concentrations in each graph indicate time and dose dependency of the synthesized complex.
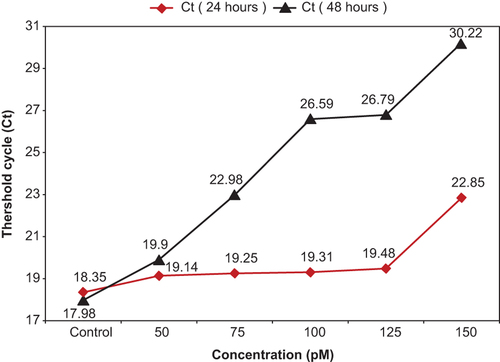
Figure 5. Q- PCR threshold cycle of the encapsulated siRNA. The Ct value assigned to a particular well reflects the point during the reaction at which a sufficient number of amplicons have accumulated. All duplicate amplifications showed very similar results, and average Ct for each sample in 24h and 48h was obtained and compared. With increasing in the amount of concentration and the treated time, the amount of Ct was increased.
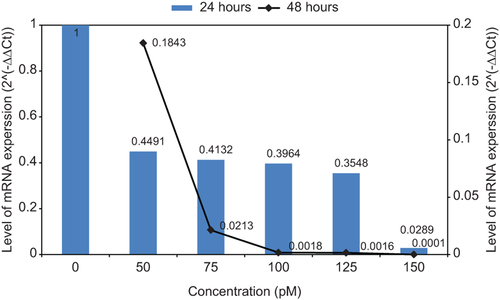
Figure 6. TERT mRNA expression level in different concentration and the effect of 48h treatment on gene expression. When concentration increased from 50 to 150 pM, for 24 h treatment, the gene expression level was decreased from 0.4491 to 0.0289, and for 48 h treatment, it was decreased from 0.1843 to 0.0001.
Figure 7. Silencing effect of siRNA-loaded MNPs. Comparison of the gene silencing effect of naked siRNA and encapsulated siRNA shows the efficiency of synthesized complex as delivery system.

Reprints and Corporate Permissions

Please note: Selecting permissions does not provide access to the full text of the article, please see our help page How do I view content?

To request a reprint or corporate permissions for this article, please click on the relevant link below:

Academic Permissions

Please note: Selecting permissions does not provide access to the full text of the article, please see our help page How do I view content?

Obtain permissions instantly via Rightslink by clicking on the button below:

If you are unable to obtain permissions via Rightslink, please complete and submit this Permissions form. For more information, please visit our Permissions help page.