Figures & data
Figure 1. Gel electrophoresis images. (A) PCR was performed using the Adeno-X forward PCR primer and reverse PCR primer; (B) Plasmids of recombinant adenoviral vector were digested with enzyme PI-Sce I and I-Ceu I followed by electrophoresis on agarose gel. 1-DNA ladder; 2,3,4-the products of digestion; (C) After co-transfection of BMSCs, the expression of BMP-2 induced by DOX, was verified by RT-PCR. 1-DNA ladder; 2-BMP-2; 3-β-actin.
Figure 2. Expression level of BMP-2 in different DOX concentrations by ELISA analysis. BMSCs were seeded into 24-well culture plates at a density of 3 × 10⁴ cells per well, 4h after co-transfection of rat BMSCs with ADV-hBMP2 and Adeno-X Tet-On, the culture fluids were replaced with 3 mL of fresh DMEM with supplement of 2% FBS and DOX (Sigma–Aldrich) at the following concentration: 0, 10−4, 10−3, 10−2, 10−1, 1, 10 μg/mL. Following additional 48-h incubation, the culture medium was collected to evaluate the expression level of BMP-2 by means of ELISA kit (R&D) according the manufacturer's manual. Results show highly significant differences between the induced and uninduced samples (p < 0.0001) when DOX concentration was over 0.001 ug/ml.
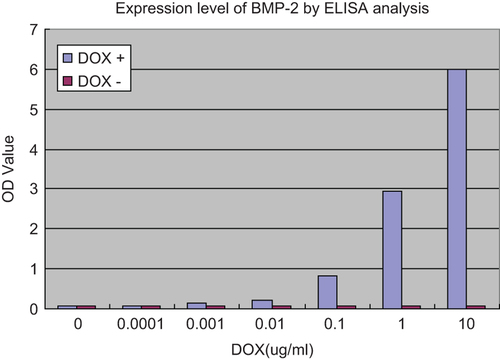
Figure 3. BMSCs in APA microcapsules and viability of BMSCs in APA microcapsules. (A) BMSCs in APA microcapsules observed under light microscope; (B) FDA/EB staining for BMSCs in APA microcapsules observed under fluorescent microscope; (C) Curve of viability for BMSCs. 100 μL of microcapsule solution was harvested and transferred to each well in a 24-well plate and cell number per well was approximately 3 × 10⁴. Then FDA/EB solution was added to each well at day 0, 1, 2, 4, 6, 10, 14, respectively to measure fluorescence intensity using fluorescence spectrophotometer at △ λ = 40 nm. Two peak values were obtained at the spectrum range of 500–650 nm. There, the peak value at 530 nm represented living cells and the peak value at 590 nm represented dead cells. Three samples for each time point were performed. No significant differences of the viability of BMSCs in APA microcapsules were observed after 14 days between the induced and uninduced samples (F = 15.486, P = 0.19).
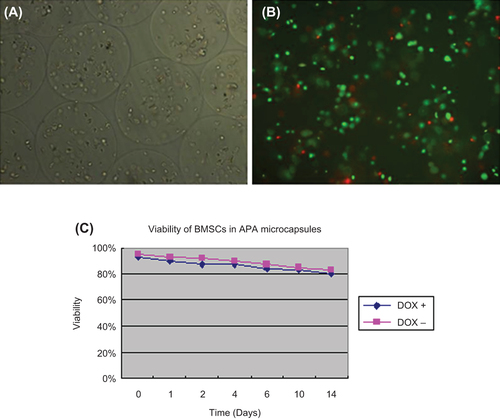
Figure 4. Expression level of BMP-2 in APA microcapsules by ELISA analysis. BMSCs in APA microcapsules were seeded into 24-well culture plates at a density of 3 × 10⁴ cells per well, 4h after co-transfection of rat BMSCs with ADV-hBMP2 and Adeno-X Tet-On, the culture fluids were replaced with 3 mL of fresh DMEM with supplement of 2% FBS and doxycycline (DOX) (Sigma–Aldrich) at the following concentration: 0, 10−1, 100, 101, 102, 2 × 10², 3 × 10² μg/mL. Following additional 48-h incubation, the culture medium was collected to evaluate the expression level of BMP-2 by means of ELISA kit (R&D) according the manufacture's manual. Results show highly significant differences between the induced and uninduced samples (p < 0.0001) when DOX concentration was over 0.1 ug/ml.
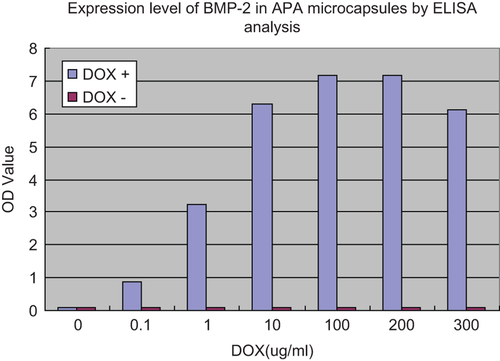
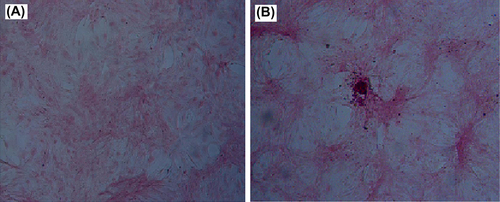
Figure 5. Alizarin red S staining. (A) Uninfected BMSCs and (B) BMSCs co-transfected with ADV-hBMP2 and Adeno-X Tet-On, respectively, were recovered from APA microcapsules and cultured in osteogenic medium for 7 days. Then the cells were fixed followed by Alizarin red S staining.