21,268
Views
343
CrossRef citations to date
0
Altmetric
Review

Application of gold nanoparticles in biomedical and drug delivery

, , , , &
Pages 410-422 | Received 31 Jul 2014, Accepted 12 Aug 2014, Published online: 17 Sep 2014

Figures & data

Figure 1. Near Infrared window.
Figure 2. Gold nanoparticles in biosensor.
Figure 3. Colloidal gold nanoparticles.
Figure 4. Design strategy for bioconjugate/hybrid gold nanoparticles.
Figure 5. Gold nanoparticles for immunosensors.
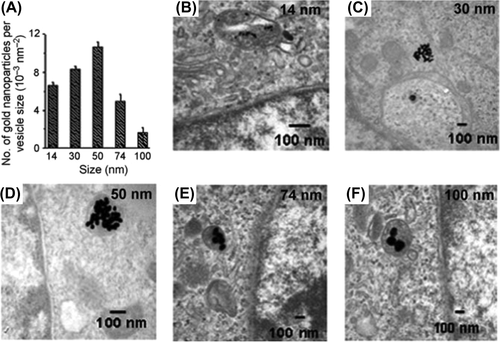
Figure 6. Transmission electron microscopy imaging and measurements of gold nanoparticles in cells. A) Graph of number of gold nanoparticles per vesicle diameter for various nanoparticle sizes. B)–F) TEM images of gold nanoparticles with sizes of 14, 30, 50, 74, and 100 nm, respectively, trapped inside vesicles of a HeLa cell.
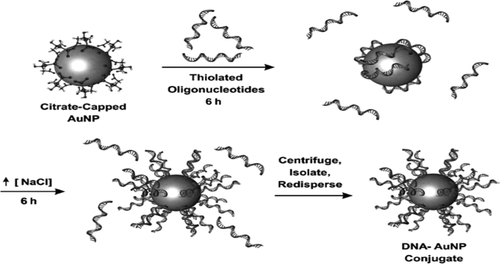
Figure 7. The synthesis of the oligonucleotide gold nanoconjugates: Alkanethiol-terminated oligonucleotides are added to citrate-stabilized GNP, thereby displacing the capping citrate ligands through formation of a gold–thiol bond. Subsequent addition of a salt shields repulsion between the strands, thus leading to a dense monolayer of oligonucleotides.
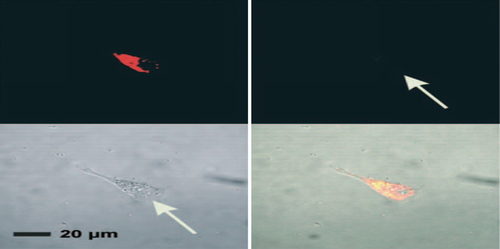
Figure 8. Fluorescent microscopy images of C166-EGFP cells incubated for 48 h with gold nanoconjugates functionalized with dual fluorophore-labeled oligonucleotides (3’-Cy3 and 5’-Cy5.5) only reveal fluorescence from Cy5.5 (706–717 nm, upper left). Negligible fluorescence is observed in the emission range of Cy3 (565–615 nm, upper right). Transmission and composite overlay images are shown in the lower left and lower right quadrants, respectively. The arrows indicate the location of the cell.

Table I. Cell types that internalize polyvalent DNA gold nanoconjugates. Cellular internalization was determined using mass spectrometry and cell-associated fluorescence measurements.
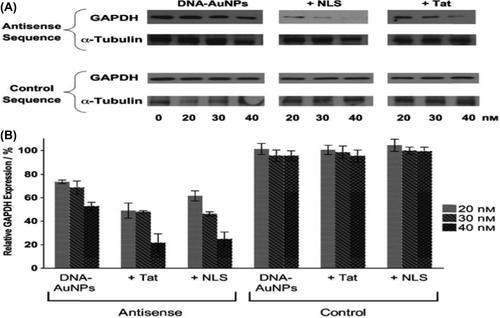
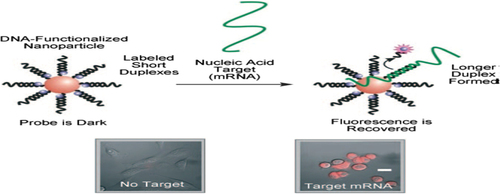
Figure 9. A) Representative Western blots showing the expression of glyceraldehyde 3-phosphate dehydrogenase (GAPDH) in HeLa cells treated with various concentrations and compositions of the gold nanoconjugates. GAPDH expression is reduced in a dose- and sequence-dependent manner. α-Tubulin is shown as the loading control. B) Relative decrease in GAPDH expression in HeLa cells. α-Tubulin was used as a loading control and for subsequent normalization of GAPDH knockdown. The error bars represent the standard deviation from at least three Western blots.
Figure 10. “Nanoflares” are gold nanoconjugates functionalized with oligonucleotide sequences complementary to a specific nucleic acid target (messenger RNA) hybridized to short fluorescent sequences. In the absence of a target, the nanoflares are dark because of quenching by the gold nanoparticle. In the presence of a target, binding displaces the short flare through the formation of a longer (more energetically favorable) duplex. The result is a fluorescence signal inside the cell, which indicates the target has been detected. Scale bar: 20 mm.
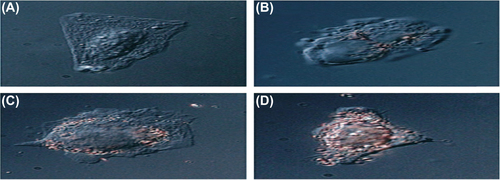
Figure 11. Images of nanoparticle–peptide complexes incubated with HepG2 cells for 2 h. Complexes were: A) nuclear localization peptide, B) receptor-mediated endocytosis peptide, C) adenoviral fiber protein, and D) both nuclear localization and receptor-mediated endocytosis peptides.
Figure 12. Templated synthesis of spherical HDL nanoparticles through use of thiol-terminated peptides and the protein (APOA1). Adapted from Ref. [111], with permission from the American Chemical Society; Copyright 2009.
Figure 13. Sol-particle immunoassay: a scheme of conjugate aggregation caused by binding to target molecules (a) and corresponding changes in the sol color and absorption spectra.
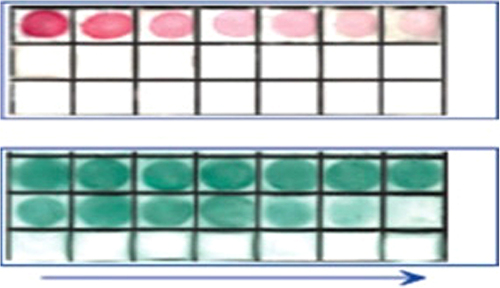
Figure 14. Dot immunoassays of a normal rabbit serum (1 by using 15-nm GNPs and silica/gold nanoshells (180-nm-core diameter and 15-nm gold shell) conjugated to sheep's antirabbit antibodies. The IgG quantity equals 1 μg for the first (upper left) square and is decreased by two-fold dilution (left to right). The bottom rows (2) correspond to a negative control (10 μg BSA in each square).
Figure 15. Positive (1) and negative (2) results of an immunochromatography assay.
Figure 16. Scheme for detection of target molecules with a BIA core device based on a total internal reflection prism covered by a thin gold layer. Adapted from Ref.
Figure 16. Scheme for detection of target molecules with a BIA core™ device based on a total internal reflection prism covered by a thin gold layer. Adapted from Ref.

Reprints and Corporate Permissions

Please note: Selecting permissions does not provide access to the full text of the article, please see our help page How do I view content?

To request a reprint or corporate permissions for this article, please click on the relevant link below:

Academic Permissions

Please note: Selecting permissions does not provide access to the full text of the article, please see our help page How do I view content?

Obtain permissions instantly via Rightslink by clicking on the button below:

If you are unable to obtain permissions via Rightslink, please complete and submit this Permissions form. For more information, please visit our Permissions help page.