
Figures & data
Figure 1. Electrochemical characterization of the biosensor [(A) Cyclic voltammograms of VEGF-R1 immobilization on gold electrode modified with MUA, -◊-◊-:Bare Au, -+-+-: Au/MUA, -•-•-:Au/MUA/EDC-NHS, -□-□-: Au/MUA/EDC-NHS/VEGF-R1, -Δ-Δ-: Au/MUA/EDC-NHS/VEGF-R1/BSA. (B) Electrochemical impedance spectra of VEGF-R1 immobilization steps, -+-+-: Bare Au, -•-•-: Au/MUA, -□-□-: Au/MUA/EDC-NHS, -◊-◊-: Au/MUA/EDC-NHS/VEGF-R1, -Δ-Δ-: Au/MUA/EDC-NHS/VEGF-R1/].
![Figure 1. Electrochemical characterization of the biosensor [(A) Cyclic voltammograms of VEGF-R1 immobilization on gold electrode modified with MUA, -◊-◊-:Bare Au, -+-+-: Au/MUA, -•-•-:Au/MUA/EDC-NHS, -□-□-: Au/MUA/EDC-NHS/VEGF-R1, -Δ-Δ-: Au/MUA/EDC-NHS/VEGF-R1/BSA. (B) Electrochemical impedance spectra of VEGF-R1 immobilization steps, -+-+-: Bare Au, -•-•-: Au/MUA, -□-□-: Au/MUA/EDC-NHS, -◊-◊-: Au/MUA/EDC-NHS/VEGF-R1, -Δ-Δ-: Au/MUA/EDC-NHS/VEGF-R1/].](/cms/asset/c13f84a0-1f6d-41a0-8abe-318e34e253fb/ianb_a_962743_f0001_oc.jpg)
Figure 2. Optimum incubation period for the formation of SAM MUA [Electrochemical impedance spectra obtained for different MUA incubation periods, -•-•-: 1 h, -□-□-: 2 h, -+-+-: 3 h, -♦-♦-:5 h].
![Figure 2. Optimum incubation period for the formation of SAM MUA [Electrochemical impedance spectra obtained for different MUA incubation periods, -•-•-: 1 h, -□-□-: 2 h, -+-+-: 3 h, -♦-♦-:5 h].](/cms/asset/3bbad07b-09eb-4bc0-9d01-5a299ba96d5a/ianb_a_962743_f0002_b.gif)
Figure 3. The effect of concentration ratio of EDC/NHS couple [Electrochemical impedance spectra obtained for different EDC/NHS ratios, -Δ-Δ-: 0.004 mM EDC/0.001 mM NHS, -□-□-: 0.04 mM EDC/0.01 mM NHS, -◊-◊-: 0.4 mM EDC/0.1 NHS, -+-+-: 4 mM EDC/1 mM NHS].
![Figure 3. The effect of concentration ratio of EDC/NHS couple [Electrochemical impedance spectra obtained for different EDC/NHS ratios, -Δ-Δ-: 0.004 mM EDC/0.001 mM NHS, -□-□-: 0.04 mM EDC/0.01 mM NHS, -◊-◊-: 0.4 mM EDC/0.1 NHS, -+-+-: 4 mM EDC/1 mM NHS].](/cms/asset/e151e2ea-25a8-4add-88f1-496075c5568e/ianb_a_962743_f0003_b.gif)
Figure 4. The effect of VEGF-R1 incubation period on immobilization performance [Electrochemical impedance spectra obtained for different VEGF-R1 incubation periods, -+-+-: 1 h, -◊-◊-:2 h, -Δ-Δ-: 3 h, -□-□-: 4 h].
![Figure 4. The effect of VEGF-R1 incubation period on immobilization performance [Electrochemical impedance spectra obtained for different VEGF-R1 incubation periods, -+-+-: 1 h, -◊-◊-:2 h, -Δ-Δ-: 3 h, -□-□-: 4 h].](/cms/asset/0969d6fc-ed71-4424-8261-95a1a85483fd/ianb_a_962743_f0004_b.gif)
Figure 5. The effect of VEGF-R1 amount on immobilization performance [Electrochemical impedance spectra obtained for different VEGF-R1 amounts, -o-o-:500 μg/mL, -◊-◊-:125 μg/mL, -□-□-: 85 μg/mL, -Δ-Δ-: 65 μg/mL].
![Figure 5. The effect of VEGF-R1 amount on immobilization performance [Electrochemical impedance spectra obtained for different VEGF-R1 amounts, -o-o-:500 μg/mL, -◊-◊-:125 μg/mL, -□-□-: 85 μg/mL, -Δ-Δ-: 65 μg/mL].](/cms/asset/d3f48e4f-ca48-4922-bc9e-6a0f332a2775/ianb_a_962743_f0005_b.gif)
Figure 6. Optimum incubation period for the interaction between VEGF-R1 and VEGF [-+-+-: 1 h, -◊-◊-:2 h, -□-□-: 3 h].
![Figure 6. Optimum incubation period for the interaction between VEGF-R1 and VEGF [-+-+-: 1 h, -◊-◊-:2 h, -□-□-: 3 h].](/cms/asset/a59f9c8e-7d42-43c1-94fc-9241ccc97911/ianb_a_962743_f0006_b.gif)
Figure 7. Cyclic voltammograms (A) and impedance spectra (B) obtained for different concentrations of VEGF.
Figure 8. VEGF calibration curve related with the proposed biosensor based MUA.
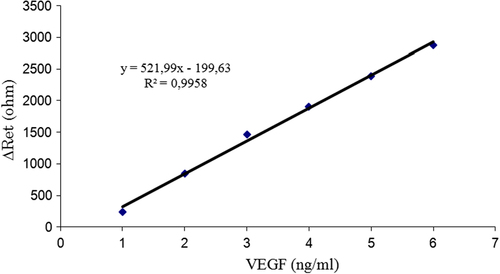
Table I. The results for Kramers–Kronig transforms, reproducibility, and the sample analysis.
Figure 9. The plots of Kramers-Kronig transforms performed on different layers of the proposed biosensor. [The turquoise lines show Kramers-Kronig Transforms performed and fitted on the experimental data and the black lines show experimental results. -■-■-:Bare Au electrode -•-•-:Au/MUA/EDC-NHS, -♦-♦-: Au/MUA/EDC-NHS/VEGF-R1, -▲-▲-: Au/MUA/EDC-NHS/VEGF-R1/BSA, inserted plot:Au/MUA].
![Figure 9. The plots of Kramers-Kronig transforms performed on different layers of the proposed biosensor. [The turquoise lines show Kramers-Kronig Transforms performed and fitted on the experimental data and the black lines show experimental results. -■-■-:Bare Au electrode -•-•-:Au/MUA/EDC-NHS, -♦-♦-: Au/MUA/EDC-NHS/VEGF-R1, -▲-▲-: Au/MUA/EDC-NHS/VEGF-R1/BSA, inserted plot:Au/MUA].](/cms/asset/270ea64c-5d4e-4723-8e28-ab038b7a84d8/ianb_a_962743_f0009_oc.jpg)