
Figures & data
Table I. Composition of test liquids.
Figure 1. Mean arterial blood pressure. 2/3 volume of blood was removed to result in 90 min of hemorrhagic shock at MAP of 30 mmHg. After this, different fluids were reinfused. Reinfusion with 3 volumes of lactated Ringer's solution increased MAP transiently and fell to 43.3 ± 2.8 mmHg. Blood (Hb 15 g/dl) maintained the MAP at 91.3 ± 3.6 mmHg, while polyHb-SOD-CAT-CA (Hb 10 g/dL) maintained it at 87.5 ± 5 mmHg, polyHb-SOD-CAT at 86.0 ± 4.6 mmHg, polySFHb at 85.0 ± 2.5 mmHg, and polyHb at 82.6 ± 3.5 mmHg.
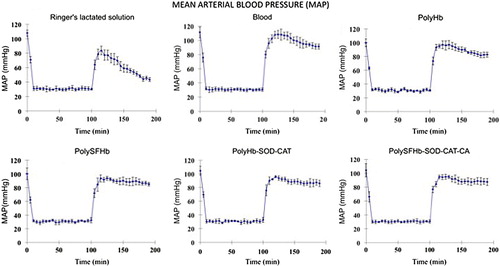
Figure 2. Comparison of mean blood pressures. The above individual measurements were pooled together for comparison. Sham control measurement, where no blood loss occurred, was added as control.
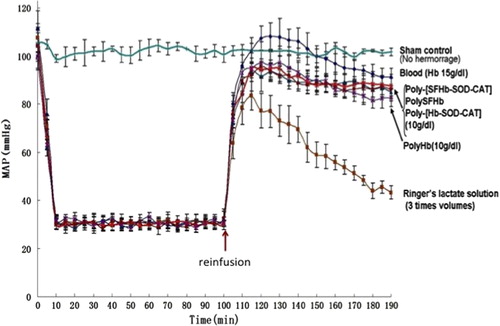
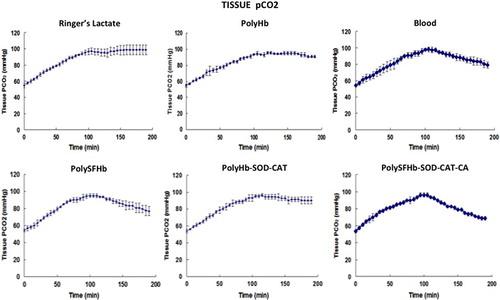
Figure 4. Comparison of pCO2. The above measurements of each group were pooled together for comparison. Sham control measurement, where no blood loss occurred, was added as control. The results showed that reinfusion with polyHb-SOD-CAT-CA reduced this to 68.6 ± 3 mmHg in 1 h. This was significantly (p < 0.05) more effective than lactated Ringer's solution (98 ± 4.5 mmHg), polyHb (90.1 ± 4.0 mmHg), polyHb-SOD-CAT (90.9 ± 1.4 mmHg), blood (79.1 ± 4.7 mmHg), and polySFHb (77 ± 5 mmHg).
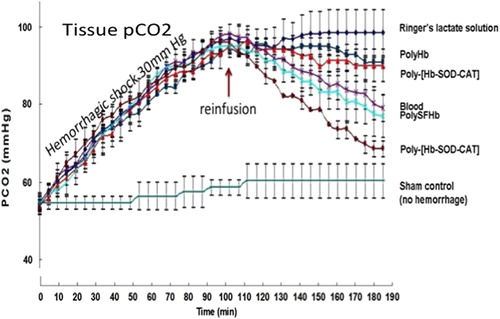
Figure 5. ST elevation. PolyHb-SOD-CAT-CA reduced the ST to 21.7 ± 6.7%. This was significantly (p < 0.05) better than polyHb (57.7 ± 8.7%), blood (39.1 ± 1.5%), polySFHb (38.3% ± 2.1%), and polyHb-SOD-CAT (27.8 ± 5.6%). Lactated Ringer's solution exhibited no significant (p > 0.05) effects (106 ± 3.1%).
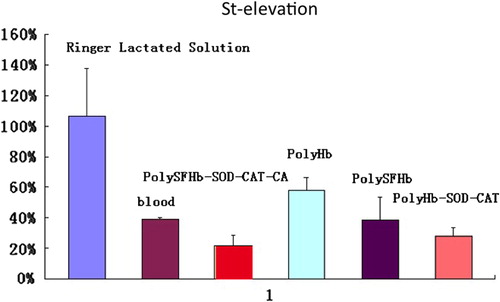
Figure 6. Plasma lactate. PolyHb-SOD-CAT-CA reduced the plasma lactate level from 18 ± 2.3 mM/L to 6.9 ± 0.3 mM/L. It was significantly (p < 0.05) more effective than lactated Ringer's solution (12.4 ± 0.6 mM/L), polyHb (9.6 ± 0.7 mM/L), blood (8.1 ± 0.2 mM/L), polySFHb (8.4 ± 0.1 mM/L), and polyHb-SOD-CAT (7.6 ± 0.3 mM/L).
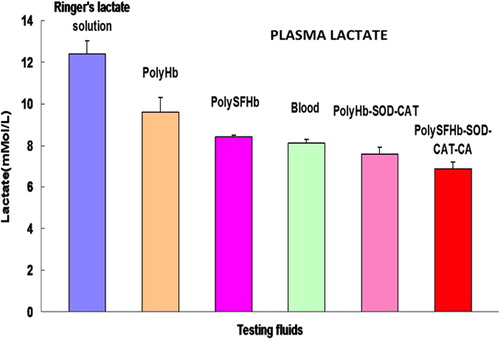
Table II. Histology of organs 60 min after reinfusion.
Table III. Effects of storage time and temperature on stability.
Table IV. Comparison of polyHb-SOD-CAT-CA with RBC.