Figures & data
Figure 1. Cyclic voltograms of electropolymerization of aniline.
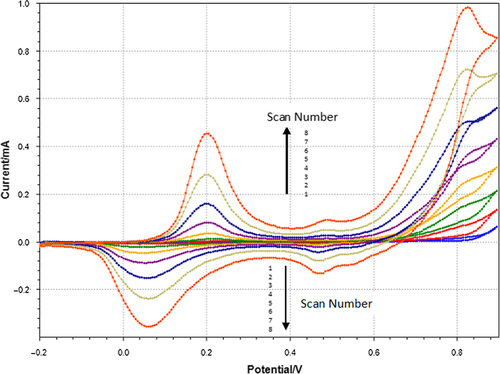
Figure 2. Impedance spectra of the immobilization steps [a) -▲-▲-(blue): PANI electrode, b) -•-•-(green): PANI–GLT electrode, -■-■-(red): PANI–GLT–CAT electrode].
![Figure 2. Impedance spectra of the immobilization steps [a) -▲-▲-(blue): PANI electrode, b) -•-•-(green): PANI–GLT electrode, -■-■-(red): PANI–GLT–CAT electrode].](/cms/asset/4030ad33-6f8e-42ce-aabf-da6f23857dfb/ianb_a_978979_f0002_oc.jpg)
Figure 3. The effect of aniline concentration on the biosensor response.
Figure 4. The effect of GLT concentration on the biosensor response.
Figure 5. The effect of GLT incubation period on the biosensor response.
Figure 6. The effect of enzyme amount on the biosensor response.
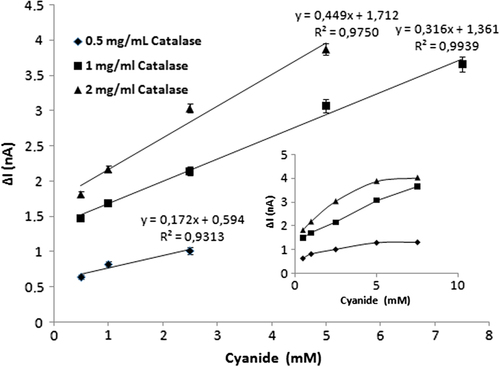
Figure 7. The effect of the number of scans on the biosensor response.
Figure 8. Effect of temperature on the biosensor response.
Figure 9. Effect of pH on the biosensor response.
Figure 10. Calibration curve of the biosensor.
Table I. Comparison of the methods developed and some of the reported methods for the cyanide determination.
Figure 11. Storage stability of the biosensor.
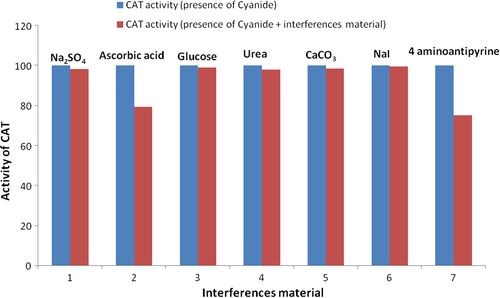
Figure 12. Effect of interference materials on biosensor response.