Figures & data
Table I. The list of primers for miR128.
Figure 1. (A) The iPS colony with distinctive borders on SNL feeder cells (100 × magnification). (B) EB formation in suspension culture.
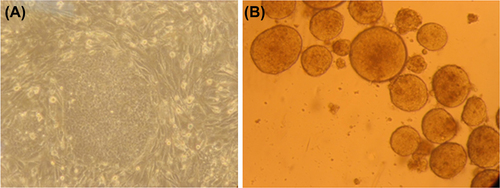
Figure 2. Lentiviral transduction of iPS cells. (A) EBs harboring the miR128 gene and GFP after viral transduction on day-2; (B) Transduced iPS cells flattened on 60mm dishes on day-4; (C) iPS cells on day-10 (in the suspension method, the cells were selected by puromycin).
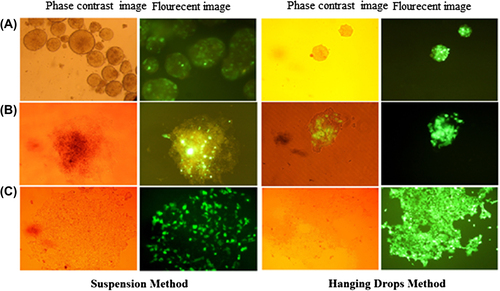
Figure 3. Flow cytometric analysis of lentiviral vector-mediated transduction of iPS cells, in comparison with untransduced cells. The red histograms represent untransduced controls, and the blue histograms represent cells transduced with miR-128 and the GFP-harboring vector. The percentages of GFP-positive cells are indicated. (A) The suspension cell method on day-4, before puromycin selection; (B) The suspension cell method on day-10, after puromycin selection; (C and D) The hanging drop method on days 4 and 10, respectively.
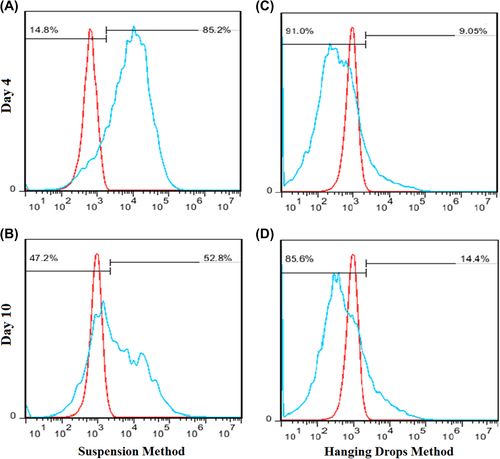
Figure 4. Relative expression of miR-128. The relative expression of miR-128 is significantly elevated in the hanging drop method (**P < 0.01) than in the suspension method (*P < 0.05), in comparison with the backbone. The error bars represent standard deviation.
Figure 5. The viability of iPS cells transduced with miR-128 using the suspension method and the hanging drop method, in comparison with untransduced cells. Cell survival in the suspension method is significantly lower than that of untransduced cells (*P < 0.05). The error bar represents standard deviation.