Figures & data
Figure 1. TEM photographs of (A) Liposomal, (B) Niosomal, and (C) Emulsomal formulations.
Table I. The characterization of the formulations by particle size, PI and EE %.
Figure 2. In vitro release of CAP in PBS (pH 7.4) for liposomal, niosomal, and emulsomal formulations, and plain gel. Values are expressed as mean ± standard deviation (n = 3).
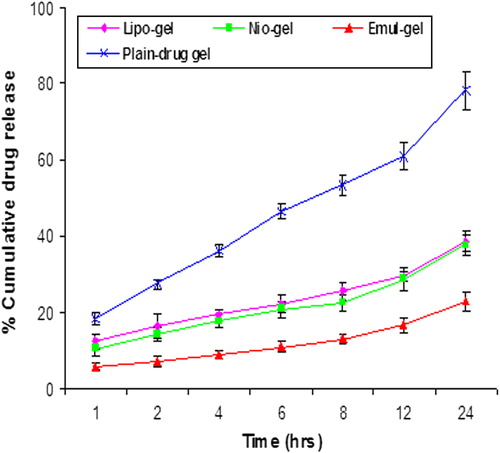
Figure 3. In vitro skin permeation of CAP for emul-gel, lipogel, nio-gel and plain drug- gel. Values are expressed as mean ± standard deviation (n = 3).
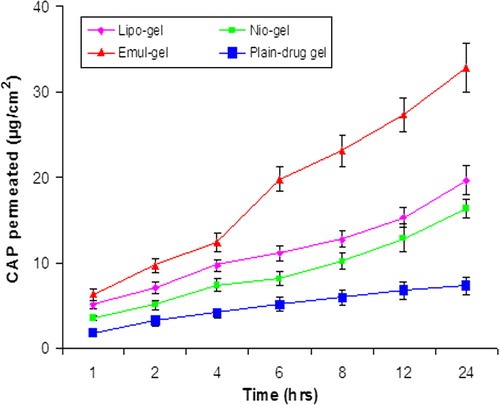
Table II. Results of in vitro permeation and skin retention studies from vesicular-gel systems and plain-drug gel: amount permeated through the skin after 24 h, flux and percentage of CAP accumulated into the skin at the end of the permeation experiments (24 h).
Figure 4. Percent CAP for emul-gel, lipo-gel, nio-gel and plain drug-gel for in vitro permeation and skin retention studies. Values are expressed as mean ± standard deviation (n = 3).
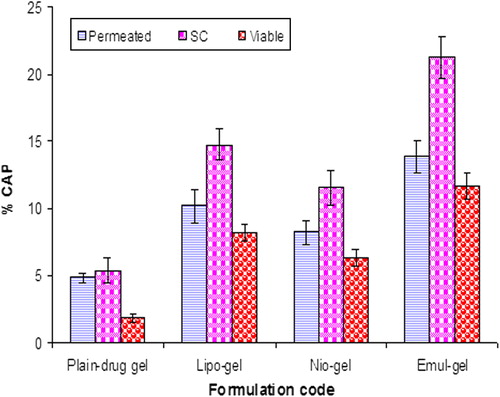
Figure 5. Percent CAP for emul-gel, lipo-gel, nio-gel and plain drug- gel in SC for in vivo studies. Values are expressed as mean ± standard deviation (n = 3).
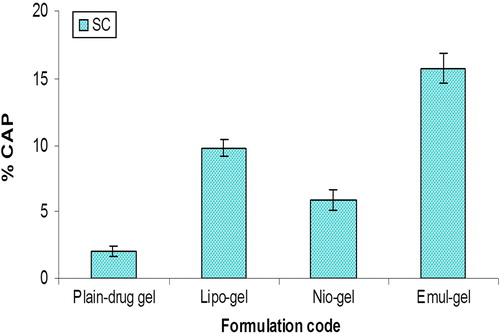
Figure 6. Percent CAP for emul-gel, lipo-gel, nio-gel and plain drug-gel in viable skin for in vivo studies. Values are expressed as mean ± standard deviation (n = 3).
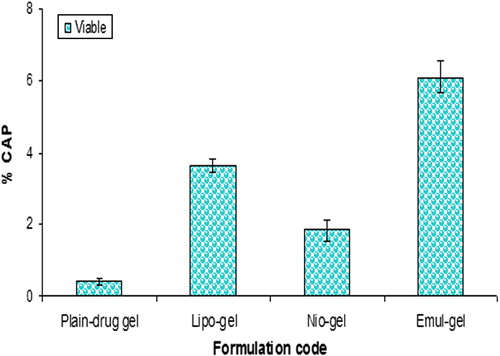
Table III. Mean erythemal scores and PII observed for various CAP formulations obtained at the end of 24, 48, and 72 h (n = 3).
Figure 7. CLSM images of a cross-section of rat skin with different dye-loaded formulations. The formulations were applied for 4 h: (a) lipo-gel (b) nio-gel (c) emul-gel. The scale bar represents 200 μm.
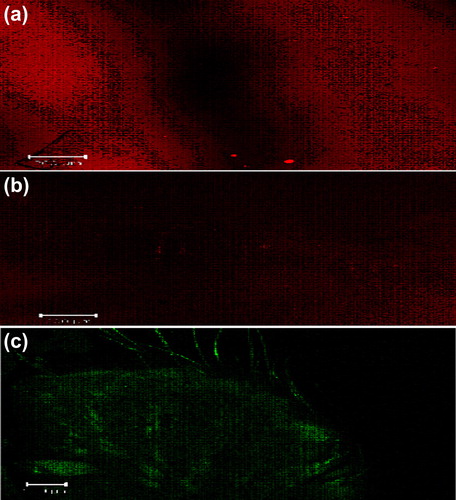
Figure 8. CLSM images of a cross-section of rat skin with different dye-loaded formulations for determining the depth of penetration into deeper skin. The formulations were applied for 4 h (a) lipo-gel (b) nio-gel (c) emul-gel.
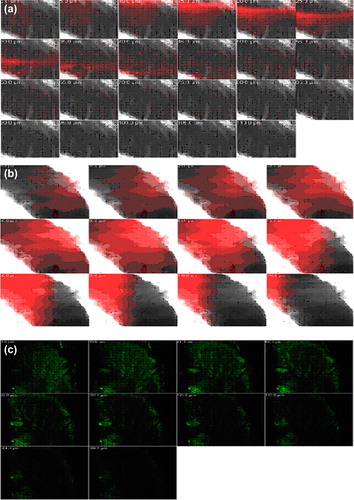
Table IV. Blind summarized scoring data from CLSM images.
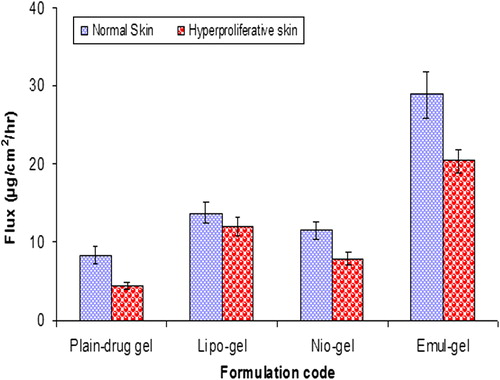
Figure 9. Comparison of the CAP fluxes from plain drug-gel and different vesicular-gel systems across normal and hyperproliferative skin. Each value represents the mean ± standard deviation (n = 3).