1,183
Views
16
CrossRef citations to date
0
Altmetric
ORIGINAL ARTICLE

Preparation and characterization of silanized poly(HEMA) nanoparticles for recognition of sugars

, , , &
Pages 835-841 | Received 22 Sep 2014, Accepted 02 Nov 2014, Published online: 03 Dec 2014

Figures & data

Figure 1. Schematic representation of the synthesis of p(HEMA) nanoparticles.
Figure 2. Schematic representation of the preparation of the p(HEMA)-APTES-PBA nanoparticles.
Figure 3. SEM photograph of p(HEMA) nanoparticles.
Figure 4. Zetasizer analysis of p(HEMA) nanoparticles.
Figure 5. FTIR spectra of p(HEMA)-APTES and p(HEMA)-APTES-PBA nanoparticles.
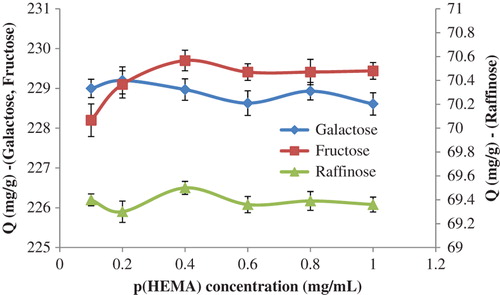
Figure 6. Effect of p(HEMA) concentration on the sugar adsorption efficiency of p(HEMA)-APTES-PBA nanoparticles. Temperature: 25°C; pH: 7.0; PBA concentration: 0.1 μg/mL; galactose concentration: 0.1 mg/mL; fructose concentration: 0.1 mg/mL; raffinose concentration: 0.33 mg/mL.
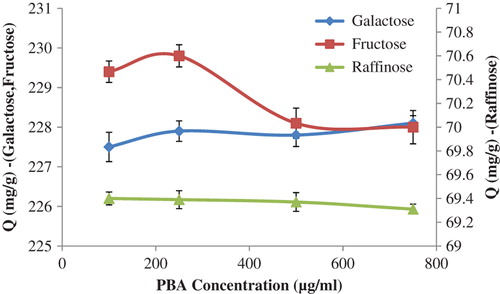
Figure 7. Effect of PBA concentration on the sugar adsorption efficiency of p(HEMA)-APTES-PBA nanoparticles. Temperature: 25°C; pH: 7.0; p(HEMA) concentration: 0.1 mg/mL; galactose concentration: 0.1 mg/mL; fructose concentration: 0.1 mg/mL; raffinose concentration: 0.33 mg/mL.
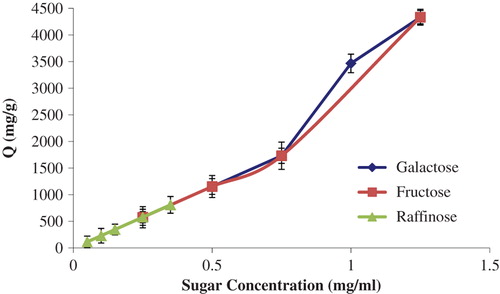
Figure 8. Effect of sugar concentrations on the sugar adsorption efficiency of p(HEMA)-APTES-PBA nanoparticles. Temperature: 25°C; pH: 7.0; p(HEMA) concentration: 0.1 mg/mL; PBA concentration: 0.1 μg/mL.
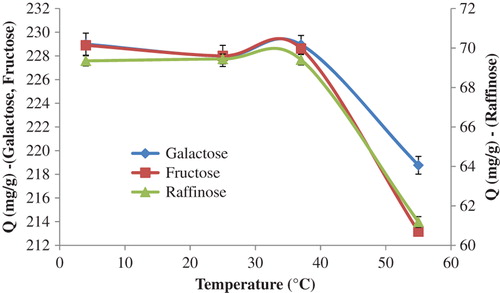
Figure 9. Effect of the temperature of the medium on the sugar adsorption efficiency of p(HEMA)-APTES-PBA nanoparticles. pH: 7.0; p(HEMA) concentration: 0.1 mg/mL; PBA concentration: 0.1 μg/mL; galactose concentration: 0.1 mg/mL; fructose concentration: 0.1 mg/mL; raffinose concentration: 0.33 mg/mL.
Figure 10. Profile of sugar separation by the p(HEMA)-APTES-PBA nanoparticles, from the soy milk.

Reprints and Corporate Permissions

Please note: Selecting permissions does not provide access to the full text of the article, please see our help page How do I view content?

To request a reprint or corporate permissions for this article, please click on the relevant link below:

Academic Permissions

Please note: Selecting permissions does not provide access to the full text of the article, please see our help page How do I view content?

Obtain permissions instantly via Rightslink by clicking on the button below:

If you are unable to obtain permissions via Rightslink, please complete and submit this Permissions form. For more information, please visit our Permissions help page.