Figures & data
Figure 1. Showing the particle size and zeta potential of ligand-conjugated Qu-NPs. (A) Particle size and Zeta potential of FA-Qu-PLGA nanoparticles. (B) Particle size and Zeta potential of MA-Qu-PLGA nanoparticles.
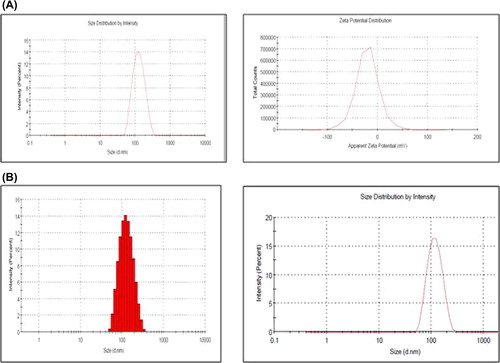
Figure 3. (A) Three-dimensional (3D) reponse surface plots showing the effect of the variable on the response (Zeta Potential-FA-Qu-PLGA) nanoparticle. (B) Three-dimensional (3D) response surface plots showing the effect of the variable on the response (Zeta Potential-Ma- Qu-PLGA).
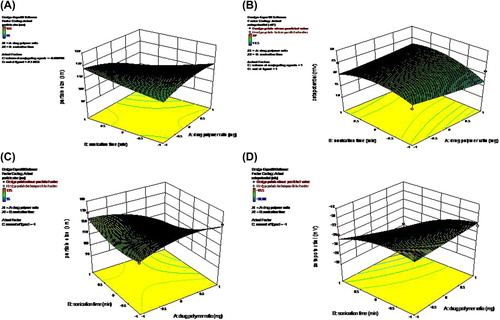
Table I. Summarizes the physiochemical characteristics of the prepared nanoformulation, before and after incorporation of FA and MA.
Table II. Solubility profile of quercetin (Qu) and its nanoformulations in different solvents.
Table III. Independent variables and their corresponding levels of Qu-PLGA NP preparation for FA binding.
Table IV. Independent variables and their corresponding levels of Qu-PLGA NP preparation for MA binding.
Table V. Predicted optimum ranges of the independent variables (MA-Qu-PLGA).
Table VI. Predicted optimum ranges of the independent variables (FA-Qu-PLGA).
Figure 4. In vitro drug release of Qu from ligand-conjugated NPs at a pH of 5.6 and 5.5. (A) The release profile of FA-Qu-PLGA &MA-Qu-PLGA NPs at a pH of 5.6, (B) The release profile of FA-Qu-PLGA &MA-Qu-PLGA-NPs at a pH of 5.5.
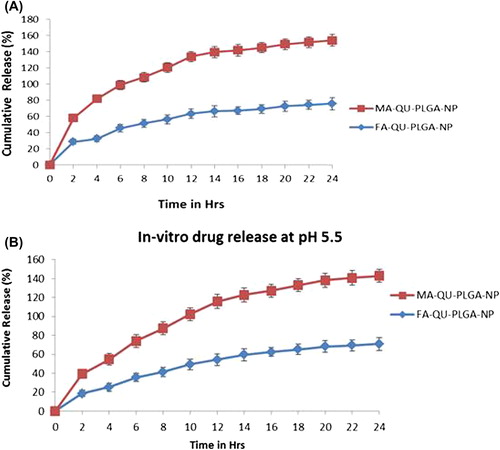
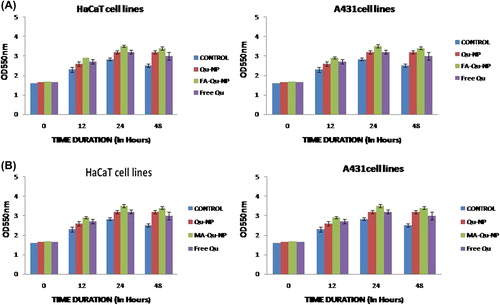
Figure 5. Decrease in OD550 shown on increasing concentration of FA-Qu-NP, MA-Qu-NP, Qu-NP, and free Qu, in both cell lines.