720
Views
5
CrossRef citations to date
0
Altmetric
ORIGINAL ARTICLE

The efficacy of methylene blue encapsulated in silica nanoparticles compared to naked methylene blue for photodynamic applications

, &
Pages 1018-1022 | Received 11 Dec 2014, Accepted 13 Jan 2015, Published online: 24 Feb 2015

Figures & data

Figure 1. Size distribution of SiNP-encapsulated MB.
Figure 2. Changes in RBC spectra during irradiation with: (a) Encapsulated MB (2.50 μM), and (b) Naked MB (25.0 μM).
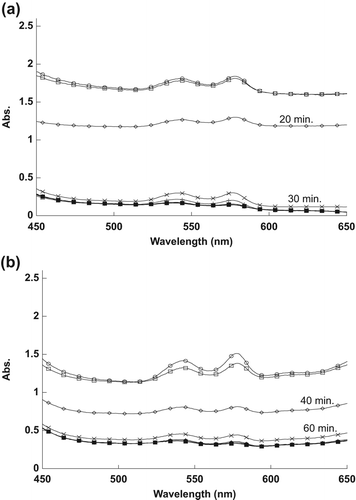
Figure 3. Changes in RBC spectra during irradiation with: (a) Encapsulated MB (1.25 μM), and (b) Naked MB (12.5 μM).
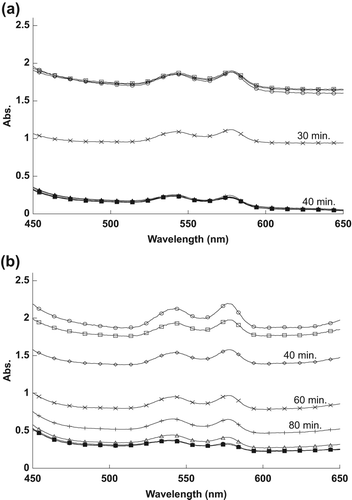
Figure 4. Changes in RBC spectra during irradiation with: (a) Encapsulated MB (0.63 μM), and (b) Naked MB (6.3 μM).
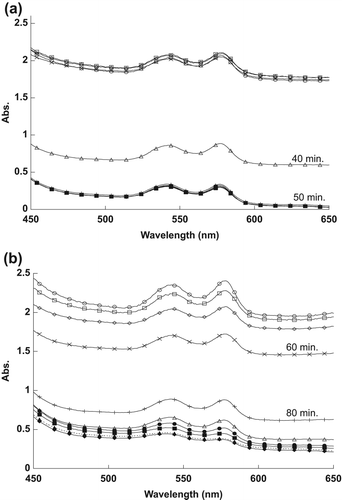
Figure 5. Changes in RBC spectra during irradiation with: (a) Encapsulated MB (0.31 μM), and (b) Naked MB (3.1 μM).
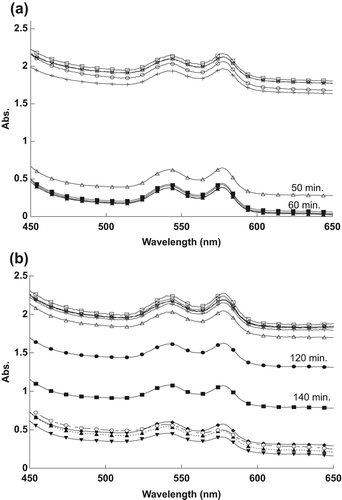
Figure 6. Changes in RBC spectra during irradiation with: (a) Encapsulated MB (0.16 μM), and (b) Naked MB (1.6 μM).
Figure 7. The reduction of the maximum peak for all samples: (a) Encapsulated MB, and (b) Naked MB.
Figure 8. The normalization of maximum peak for all samples: (a) Encapsulated MB and (b) Naked MB.
Figure 9. The relation between the half-life time of RBCs and the concentration of (a) Encapsulated MB, and (b) Naked MB.

Reprints and Corporate Permissions

Please note: Selecting permissions does not provide access to the full text of the article, please see our help page How do I view content?

To request a reprint or corporate permissions for this article, please click on the relevant link below:

Academic Permissions

Please note: Selecting permissions does not provide access to the full text of the article, please see our help page How do I view content?

Obtain permissions instantly via Rightslink by clicking on the button below:

If you are unable to obtain permissions via Rightslink, please complete and submit this Permissions form. For more information, please visit our Permissions help page.