Figures & data
Figure 1. Representative photographs showing implantation of Ti-based materials in rats. A. K-nails. B. Plates.
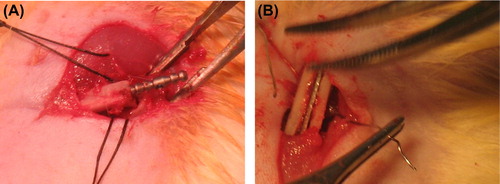
Figure 2. Representative SEM micrographs of Ti surfaces before surface modification (control) (A), after anodization (NanoTi) (B), and after HA deposition (NanoTiHA) (C).
Figure 3. Changes in formazan activity in cell cultures containing Ti plates show SAOS proliferation (both non-modified [control] and modified).
![Figure 3. Changes in formazan activity in cell cultures containing Ti plates show SAOS proliferation (both non-modified [control] and modified).](/cms/asset/c75d0e45-d1bd-4287-b88d-ff05a9930b52/ianb_a_1008512_f0003_b.gif)
Figure 4. Changes in ALP activity in cell cultures containing Ti plates (both non-modified [control] and modified).
![Figure 4. Changes in ALP activity in cell cultures containing Ti plates (both non-modified [control] and modified).](/cms/asset/b430544f-467f-4fd0-8f37-75b0637e8195/ianb_a_1008512_f0004_b.gif)
Table I. Mechanical test.
Figure 5. Micrographs of the non-decalcified sections show bone marrow depletion and replacement by fibrous and/or bone tissue adjacent to the implant. The implant exhibits osseointegration at several contact points. I: implant; B: bone; BM: bone marrow; H&E: hematoxylin-eosin; MT: Masson's trichrome.
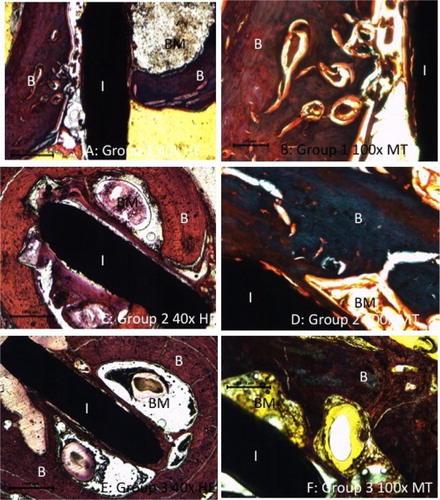
Figure 6. Boxplot graph of the histomorphometric BIC percentages. Note that the NanoTiHA group is significantly better than the control (P < 0.05).