558
Views
13
CrossRef citations to date
0
Altmetric
Original Article

Polymerized human placenta hemoglobin improves resuscitative efficacy of hydroxyethyl starch in a rat model of hemorrhagic shock

, , , , , , , & show all
Pages 174-179 | Received 10 Feb 2015, Accepted 25 Feb 2015, Published online: 26 Mar 2015

Figures & data

Table I. Properties of PolyPHb and HES solutions.

Figure 1. Volume-controlled hemorrhagic shock model in Sprague–Dawley rats. Hemorrhage (60% of BV) was completed by two steps: rapid hemorrhage (30% of BV) from 0 to 10 min and slow hemorrhage (30% of BV) from 10 to 50 min; resuscitation with PolyPHb/HES (in a 1:2 ratio) and HES 130 alone solutions from 60 to 75 min; and the observation until 72 h.
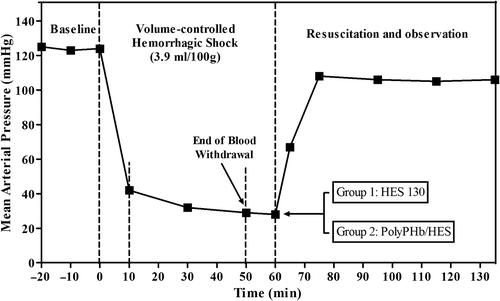
Figure 1. Volume-controlled hemorrhagic shock model in Sprague–Dawley rats. Hemorrhage (60% of BV) was completed by two steps: rapid hemorrhage (30% of BV) from 0 to 10 min and slow hemorrhage (30% of BV) from 10 to 50 min; resuscitation with PolyPHb/HES (in a 1:2 ratio) and HES 130 alone solutions from 60 to 75 min; and the observation until 72 h.

Figure 2. Hematocrit of rat arterial blood at baseline, during shock and after resuscitation. Data were presented as Mean ± SD (n = 7–8).
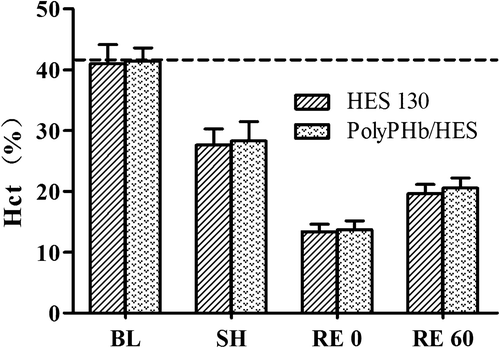
Figure 2. Hematocrit of rat arterial blood at baseline, during shock and after resuscitation. Data were presented as Mean ± SD (n = 7–8).

Figure 3. Survival rate of Sprague–Dawley rats after resuscitation from hemorrhagic shock with infusion of PolyPHb/HES (in a 1:2 ratio) and HES 130/0.4 alone.
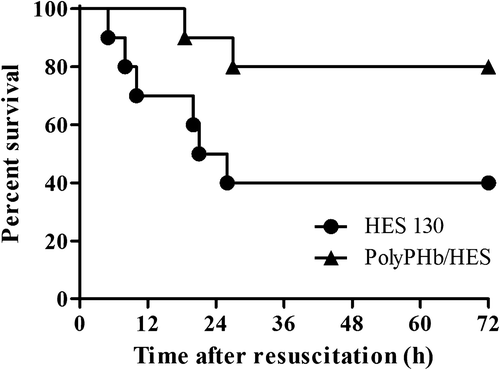
Figure 3. Survival rate of Sprague–Dawley rats after resuscitation from hemorrhagic shock with infusion of PolyPHb/HES (in a 1:2 ratio) and HES 130/0.4 alone.

Table II. Mean arterial pressure (MAP) and heart rate (HR).

Table III. Arterial blood gas during the experiment.

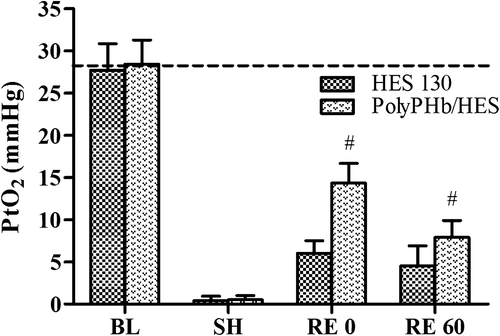
Figure 4. Subcutaneous tissue oxygen pressure (PtO2) during experiment. PtO2 values (mmHg) were presented as Mean ± SD (n = 6). #P < 0.05 vs. the HES 130 group at the same time point.

Figure 4. Subcutaneous tissue oxygen pressure (PtO2) during experiment. PtO2 values (mmHg) were presented as Mean ± SD (n = 6). #P < 0.05 vs. the HES 130 group at the same time point.

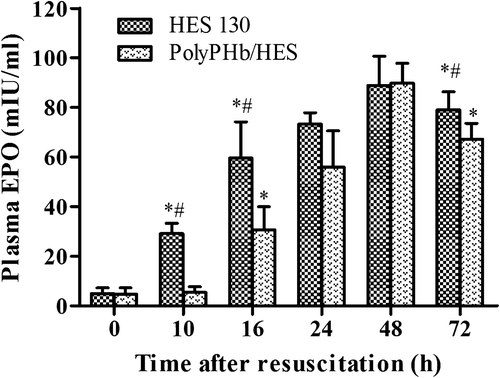
Figure 5. Plasma EPO levels at different time points after resuscitation. EPO levels (mIU/ml) were presented as Mean ± SD (n = 4–6). *p < 0.05 vs. 0 h after resuscitation, #p < 0.05 vs. the PolyPHb/HES group at the same time point.

Figure 5. Plasma EPO levels at different time points after resuscitation. EPO levels (mIU/ml) were presented as Mean ± SD (n = 4–6). *p < 0.05 vs. 0 h after resuscitation, #p < 0.05 vs. the PolyPHb/HES group at the same time point.

Reprints and Corporate Permissions

Please note: Selecting permissions does not provide access to the full text of the article, please see our help page How do I view content?

To request a reprint or corporate permissions for this article, please click on the relevant link below:

Academic Permissions

Please note: Selecting permissions does not provide access to the full text of the article, please see our help page How do I view content?

Obtain permissions instantly via Rightslink by clicking on the button below:

If you are unable to obtain permissions via Rightslink, please complete and submit this Permissions form. For more information, please visit our Permissions help page.