Figures & data
Table I. Summary table of Hb conformations according to the characteristic absorption peaks. The Hb spectral signature contains three characteristic peaks: the alpha band and beta band are characteristic of the absorption of the complex consisting of the nucleus—heme, iron, and dioxygen; the Soret band is characteristic of the absorption of the heme nucleus and polypeptide chain complex.
Figure 1. Analysis of the impact of HEMOXCell® concentration with CHO-S. CHO-S cells were cultivated in suspension for 8 days in the absence (A: 0 g/L without buffer) or with different concentrations of HEMOXCell® (B: 0 g/L; C: 0.125 g/L; D: 0.250 g/L; E: 0.500 g/L; F: 0.750 g/L; G: 1 g/L; H: 2 g/L) in the presence of the conditioning buffer. Cell density (cells/mL) was calculated for each condition during 8 days, PDT (tD) was determined during the exponential growth phase. The results correspond to the mean ± SD (n = 3 or 4 per group). P-value was calculated to control. *P < 0.05; **P < 0.01.
Figure 2. Analysis of CHO-S cell density with HEMOXCell®. CHO-S cells were cultivated with different concentrations of HEMOXCell® (from 0 to 2 g/L) during 8 days. Two culture conditions were performed without HEMOXCell®, with or without the storage buffer to control its safety. The results correspond to the mean ± SD (n = 3 or 4 per group). P-value was calculated to control: *P < 0.05; **P < 0.01.
Figure 3. Profiles of cell viability and caspase-3 activation of CHO-S cells. (A) Viability of CHO-S cells was analyzed at various HEMOXCell® concentrations. CHO-S cells were cultured during 8 days, with HEMOXCell® concentrations ranging from 0.125 to 2 g/L. Viable cells were distinguished from dead cells using the trypan blue dye exclusion method. Results are expressed as mean ± SD of 3 or 4 independent experiments. (B) Caspase-3 activation in CHO-S cells. Caspase-3 activation was determined using fluorescent staining against cleaved caspase-3. Caspase-3 is an intracellular cysteine protease activated during the cascade of events associated with apoptosis. Caspase-3 activation was observed between days 6 and 7 after kinetic start. Results are expressed in relative fluorescence units (RFU) during 7 days of culture with three HEMOXCell® concentrations (0 g/L, 0.250 g/L, and 0.500 g/L). Results are expressed as mean ± SD of 2 independent experiments.
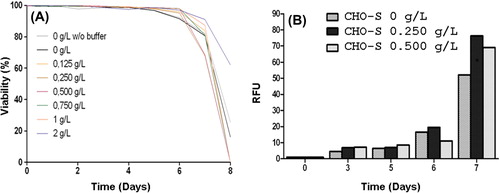
Figure 4. Apoptosis vs. necrosis detection. Fluorescent signals of annexin V (top) and propidium iodide (bottom) were measured in CHO-S cells cultivated with three HEMOXCell® concentrations (0 g/L, 0.250 g/L, and 0.500 g/L). Annexin V staining was used to detect translocation of phosphatidylserine (PS) from the internal to the external surface of the cell membrane, and propidium iodide (PI) was used to reveal necrotic cells. A positive control was obtained with an incubation of CHO-S cells with 100 μM valinomycin for 5 h, to induce cell death. Significant annexin V and PI staining were seen at the beginning of days 6 and 7 after kinetics began, respectively. The results corresponded to the mean ± SD (n = 3 or 4 per group). P-value was calculated to control: *P < 0.05; **P < 0.01.
Figure 5. Impact of HEMOXCell® for production of EGFP with CHO-EGFP cells. Transfected CHO-EGFP were cultured during 7 days with three HEMOXCell® concentrations (0 g/L, 0.250 g/L, and 0.500 g/L). EGFP-specific fluorescence was analyzed at day 0 and day 7 as relative fluorescence units (RFU). Results are expressed as mean ± SD of 4 experiments. P-value was calculated to control. *P < 0.05; **P < 0.01.
Figure 6. HEMOXCell® UV-visible spectra. (A) UV-visible absorption spectrum of HEMOXCell® under its different conformations. Soret band (γ) is between about 406 and 430 nm, beta band (β) and alpha band (α) are in the ranges of 500–555 nm and 555–630 nm respectively. (Blue: oxyhemoglobin; green: deoxyhemoglobin; pink: methemoglobin; orange: carboxyhemoglobin). (B) The absorbance of 0.750 g/L HEMOXCell® was determined as between 250 and 700 nm during the 10 days. The spectra obtained were superposed on a graphic representation. The control spectrum corresponds to HEMOXCell® diluted at 0.750 g/L in the conditioning buffer. Results were normalized at 523 nm and corresponding to one experiment. (AU = Absorption unit).
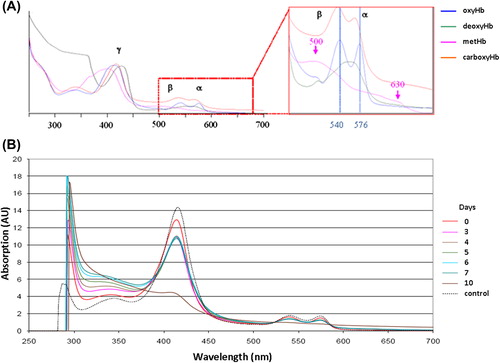
Figure 7. Structural and functional evolution of HEMOXCell® during CHO-S batch culture. The evolution of the various conformational states of HEMOXCell® during culture is represented in percentage (%) per day. Results correspond to the percentage of the structured molecule, the molecule dissociated containing heme, and the molecule dissociated without heme, in comparison with the control conditions consisting of HEMOXCell® diluted at 0.750 g/L in the conditioning buffer. The evolution of HEMOXCell® functionality during culture is represented as percentage (%) per day. Results correspond to the percentage of unoxidized functional molecules in comparison with the control conditions consisting of HEMOXCell® diluted at 0.750 g/L in the conditioning buffer.