Figures & data
Figure 1. Chemical structure of PLGA-β-CD copolymer.
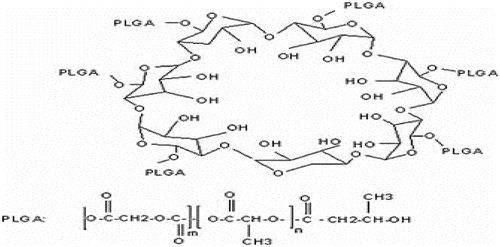
Figure 2. 1H-NMR spectrum of PLGA-β-CD copolymer.
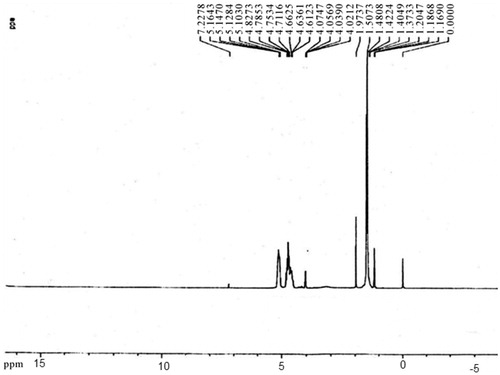
Figure 3. Fourier transform infrared spectroscopy (FT-IR) of pure methotrexate.
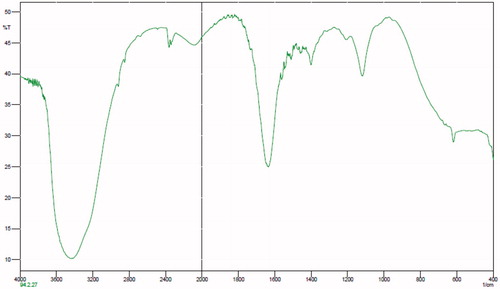
Figure 4. Fourier transform infrared spectroscopy (FT-IR) of poly (lactic-co-glycolic acid) (PLGA)-beta-cyclodextrin (βC) copolymer.
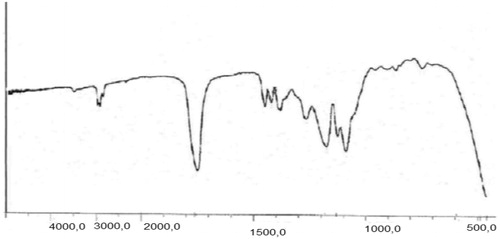
Figure 5. Fourier transform infrared spectroscopy (FT-IR) of methotrexate-poly (lactic-co-glycolic acid) (PLGA)-beta-cyclodextrin (βC) copolymer.
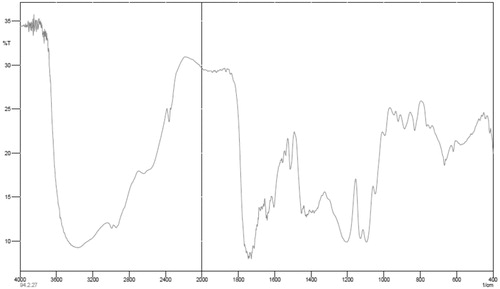
Figure 6. Scanning electron microscopy (SEM) of nanoparticles surface fabricated by PLGA-β-CD(I) with mtx.
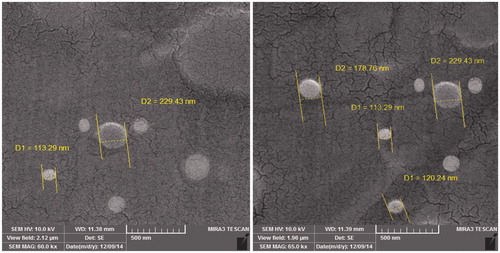
Figure 7. Cytotoxicity effect of PLGA-βC methotrexate complex and free methotrexate on T47D for 24 h. *: P values < 0.05 was considered statistically significant.
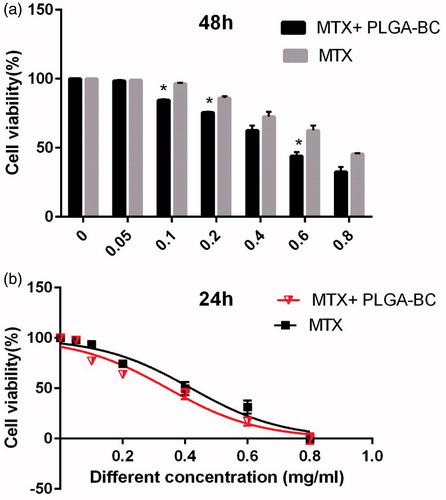
Figure 8. Cytotoxicity effect of PLGA-βC methotrexate complex and free methotrexate on T47D for 48 h. *: P values < 0.05 was considered statistically significant.
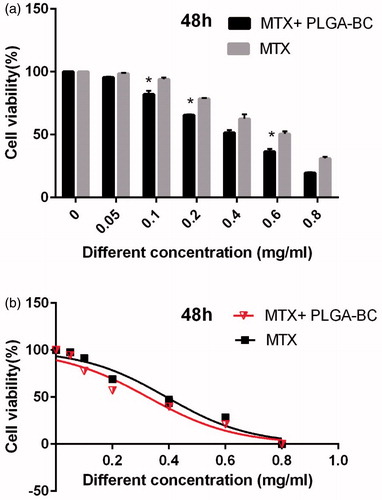
Figure 9. Cytotoxicity effect of PLGA-βC methotrexate complex and free methotrexate on T47D for 72 h. *: P values < 0.05 was considered statistically significant.
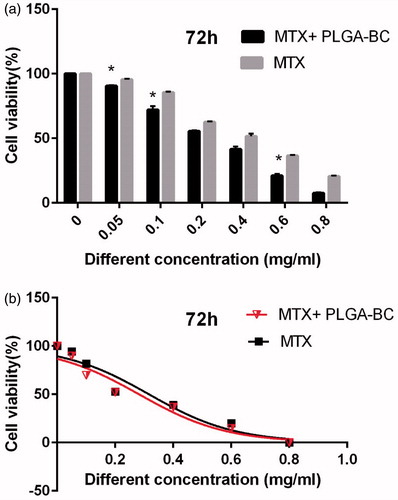
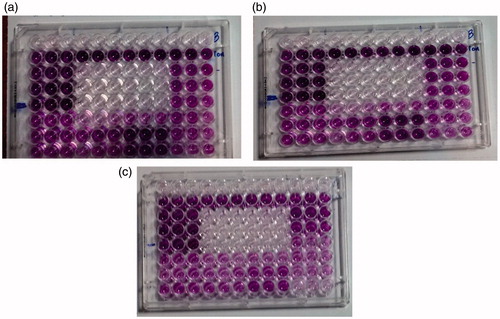
Figure 10. Cytotoxicity study of free drug and drug loaded nanoparticles on T47D cell line after, 24 h (a), 48 h (b), and 72 h (c) exposure.