Figures & data
Figure 1. The XRD spectrum of graphene oxide.
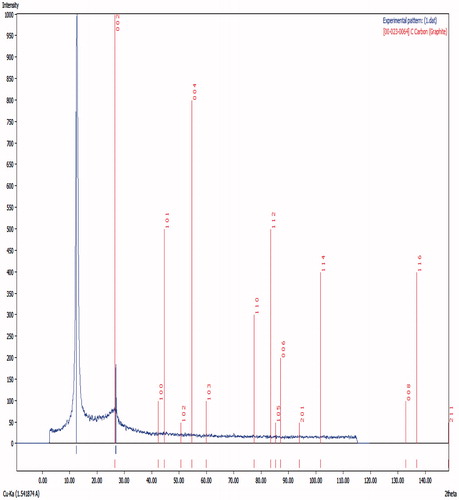
Figure 2. The FTIR spectrum of GO-PEG.
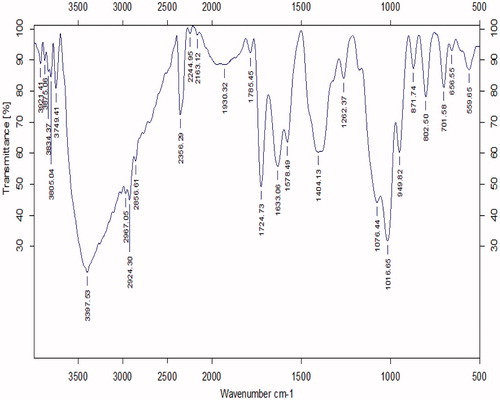
Figure 3. The FESEM imaging of GO-PEG.
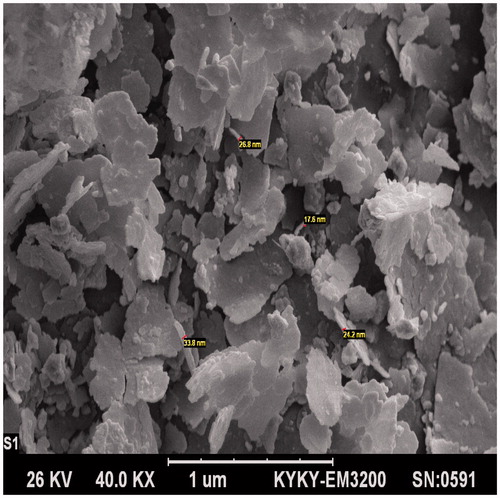
Figure 4. The viability percentage of the Hela cell line in various concentrations (0.1–100 μg/ml) of GO-PEG nanocarrier with a 24-h exposure. Each point represents a mean ± SD of four experiments with eight replicates per dose. Cell survival in concentrations of 1, 10, and 100 μg/ml are significantly different compared with the control group and 0.1 μg/ml has not significant difference. As indicated earlier, the bars, asterisks indicate p values that are statistically significant. *Symbol indicates (p < 0.05), **Symbol indicates (p < 0.01), ***Symbol indicates (p < 0.001). p values were calculated using statistical analysis software.
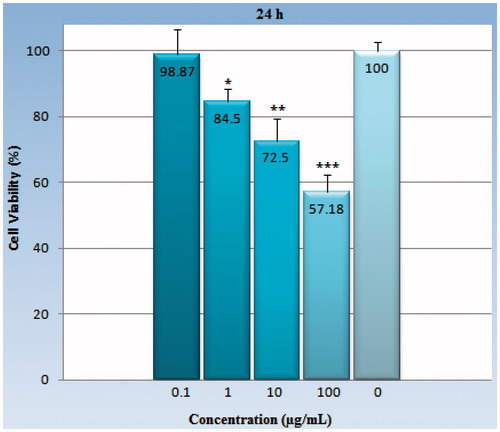
Figure 5. The viability percentage of the HeLa cell line in various concentrations (0.1–100 μg/ml) of GO-PEG nanocarrier with a 48-h exposure. Each point represents a mean ± SD of four experiments with eight replicates per dose. Cell survival in all of experimental concentrations 0.1, 1, 10, and 100 μg/ml are significantly different compared with the control group. As indicated earlier, the bars and asterisks indicate p values that are statistically significant. *Symbol indicates (p< 0.05), **symbol indicates (p< 0.01), ***symbol indicates (p< 0.001).
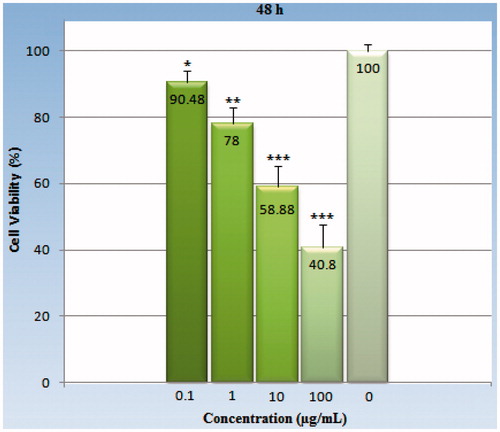
Figure 6. The viability percentage of the HeLa cell line in various concentrations (0.1–100 μg/ml) of GO-PEG nanocarrier with a 72-h exposure. Each point represents a mean ± SD of four experiments with eight replicates per dose. All of doses with p values being <0.05 are significantly different compared with the control group. As indicated earlier, the bars and asterisks indicate p values that are statistically significant. *Symbol indicates (p < 0.05), **symbol indicates (p < 0.01), ***symbol indicates (p < 0.001).
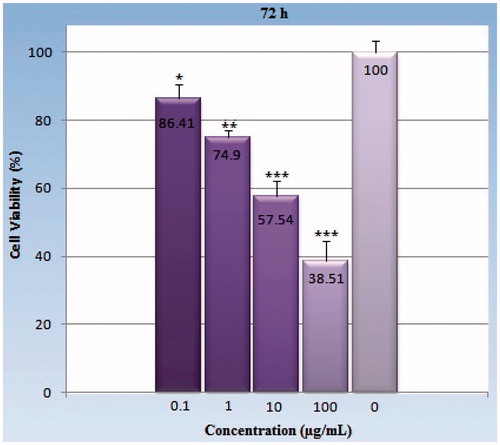
Figure 7. Analysis of exposure time–response relationship in regard to antiproliferative effect of GO-PEG on Hela cells. Each concentration (0.1, 1, 10, and 100 μg/ml) showed with a specific color which comparable in different exposure times. The cells were treated with different doses for 24, 48, and 72 h. Each point corresponds to a mean ± SD of four experiments with eight replicates per dose.
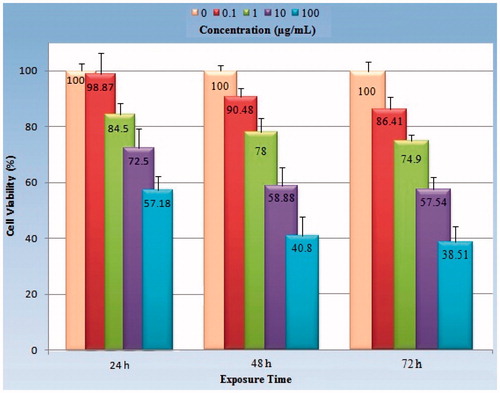
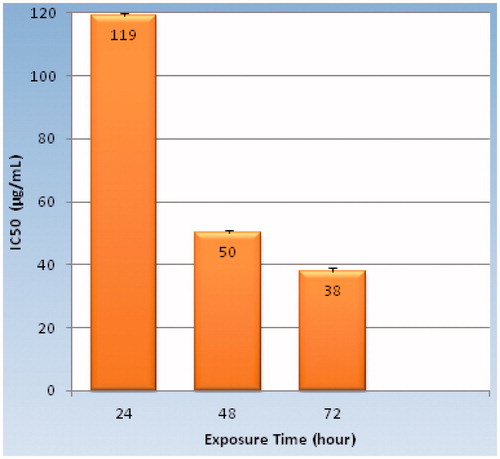
Figure 8. IC50 values (μg/mL) of GO-PEG nanocarrier on Hela cancer cell line in different incubation times (24, 48, and 72 h). IC50 = 119 ± 0.83 μg/mL for 24 h of exposure, IC50 = 50 ± 0.56 μg/mL for 48 h of exposure, IC50 = 38 ± 0.61 μg/mL for 72 h of exposure.