
Figures & data
Table 1. Definitions of modelled health states.
Figure 1. Structure of the UC MMX mesalazine model. (B) Structure of the UC MMX mesalazine model including adherent and non-adherent remission states and CRC health states.
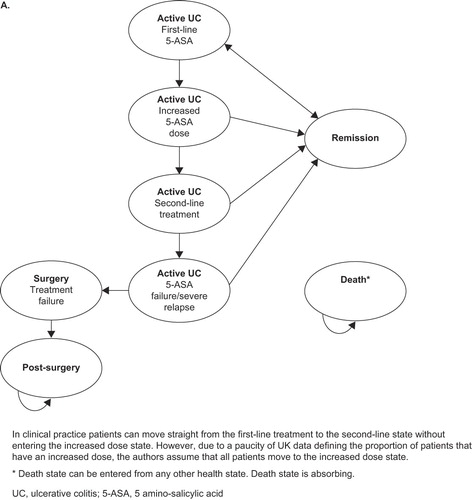
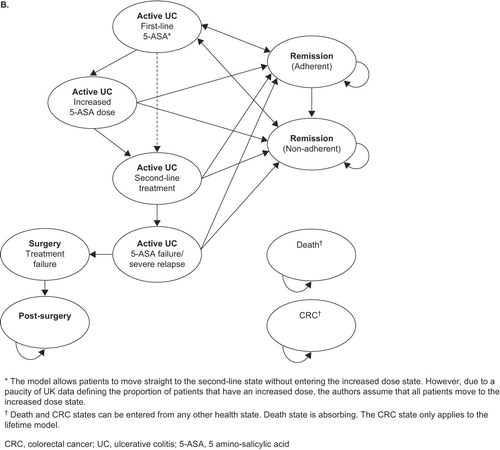
Table 2. Parameters included in the PSA and their assumed distributions.
Table 3. Transition probabilities for the base case model.
Figure 2. Percentage of patients adherent for different daily dosing regimens taken from Kane et al (2001)Citation15 and extrapolated to estimate adherence rate for once-daily dosing.
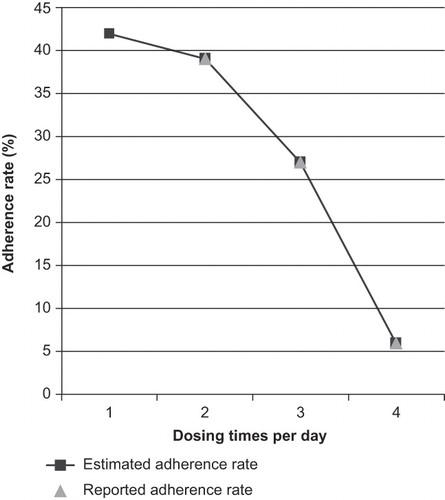
Figure 3. Risk of CRC at years 10, 20, and 30 as reported by Eaden (2001)Citation24 and the fitted Weibull curve (alpha: 2.166, beta: 62.496).
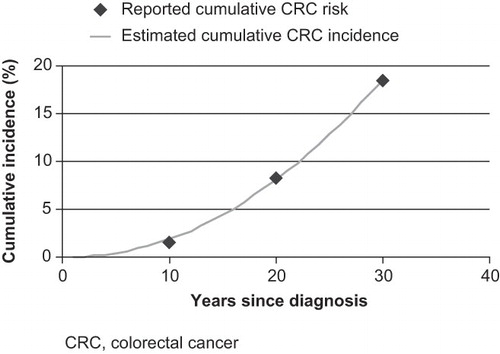
Table 4. Resource uses for each modelled health state in the model.
Table 5. Utility values for each modelled health state.
Table 6. Model results for the cost effectiveness of MMX mesalazine compared with mesalazine (values reported per patient).
Table 7A. 5-year base case model: detailed breakdown of model outputs (values reported per patient over a 5-year period with no adherence).
Figure 4. Tornado diagram.
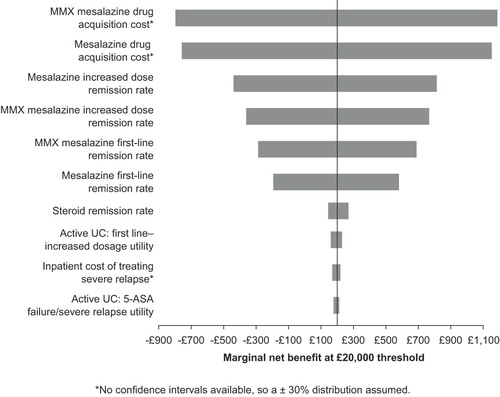
Figure 5. (A) Scatter plot of the PSA and (B) cost-effectiveness acceptability curve produced by PSA.
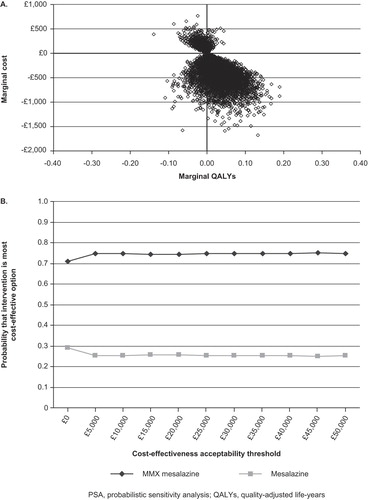
Table 7B. 5-year model with adherence effect: detailed breakdown of model outputs (values reported per patient over a 5-year period).