Figures & data
Table 1. Baseline characteristics of the cohort included in the analysis.
Figure 1. Observed risk of FTC. Vertical axis: observed risk of FTC; horizontal axis labelled: time (months); FTC, need for full-time care.
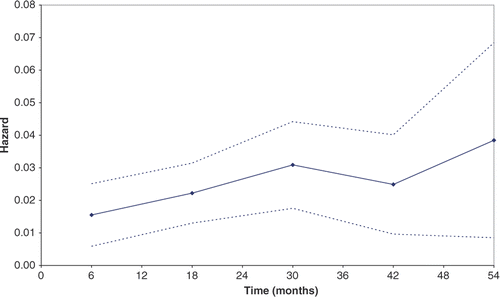
Figure 2. Proportion of patients remaining free of FTC: observed (lifetable analysis) and basic predictive equation (based only on time). Vertical axis: proportion of patients free of FTC; horizontal axis: time (months); FTC, need for full-time care.
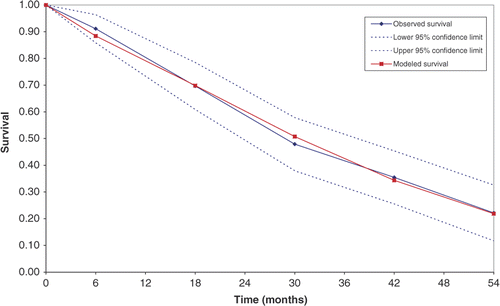
Table 2. Static and dynamic factors included in the predictive equation.
Table 3. Fit characteristics during development of the predictive equation.