Figures & data
Figure 1. Data sources for event incidence over the model time horizon.
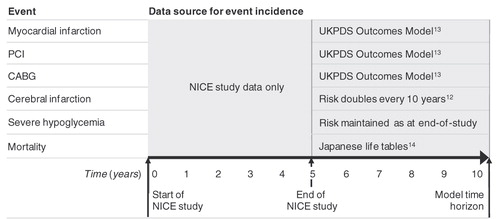
Table 1. Baseline cohort characteristics from the NICE study.
Table 2. Event and pharmacy costs used in the modelling analysis.
Table 3. Quality of life utilities.
Figure 2. Survival curve showing proportion of patients alive in the insulin aspart and regular human insulin arms.
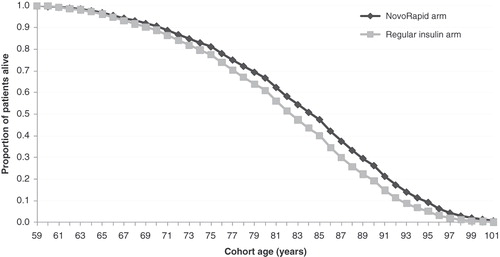
Table 4. Within-trial and post-trial cost and effectiveness outcomes.
Figure 3. Pharmacy and event costs in the insulin aspart and regular human insulin arms over a 10-year time horizon.
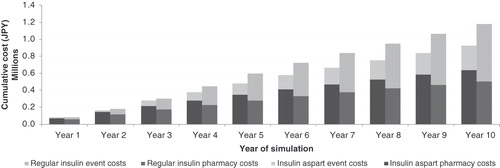
Figure 4. Break-even analysis showing (A) incremental costs, (B) net health benefit and (C) incremental QALE over a range of the observed cardiovascular and mortality benefits of insulin aspart when compared with regular human insulin (over a 5-year time horizon).
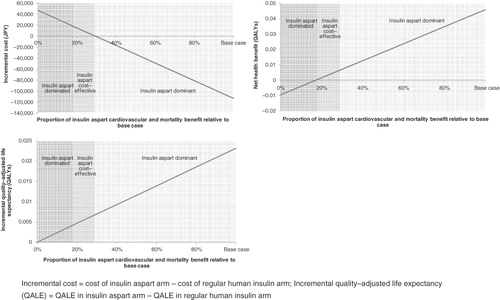
Table 5. Sensitivity analyses (5-year base case).