Figures & data
Figure 1. Structural diagram of the cost-effectiveness model.
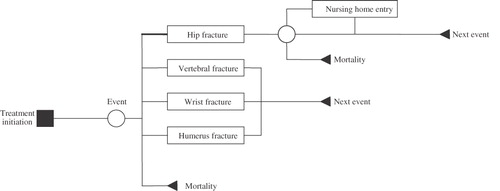
Table 1. Efficacy values for the prevention of fragility fractures in postmenopausal women.
Table 2. Annual direct costs for patients with osteoporosis.
Figure 2. Cost effectiveness by age group for selected bisphosphonates compared with basic treatment in (a) Finland, (b) Norway and (c) the Netherlands. Negative values indicate dominance, i.e. better efficacy and lower cost. ICER, incremental cost-effectiveness ratio; IV, intravenous; QALY, quality-adjusted life-year.
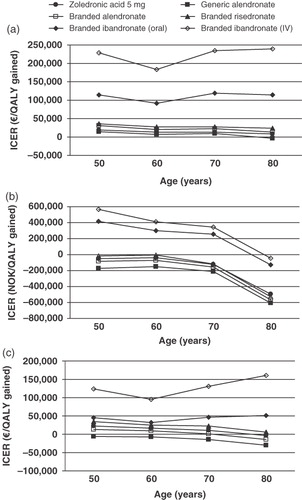
Figure 3. Cost effectiveness by age group for zoledronic acid 5 mg compared with selected bisphosphonates in (a) Finland, (b) Norway and (c) the Netherlands. Negative values indicate dominance, i.e. better efficacy and lower cost. ICER, incremental cost-effectiveness ratio; IV, intravenous; QALY, quality-adjusted life-year.
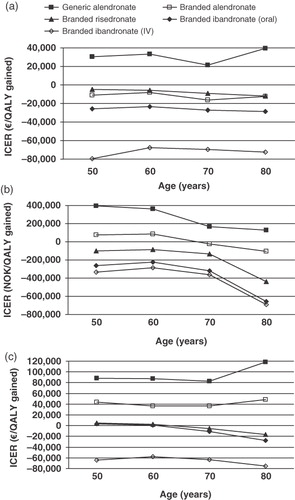
Table 3. Sensitivity analyses: Incremental cost-effectiveness ratios for zoledronic acid 5 mg versus branded alendronate.
Table 4. Sensitivity analyses: Incremental cost-effectiveness ratios for zoledronic acid 5 mg versus generic alendronate at different compliance rates for generic alendronate.