Figures & data
Table 1. Patient characteristics before and after propensity score matching.
Figure 1. Study sample flow diagram.
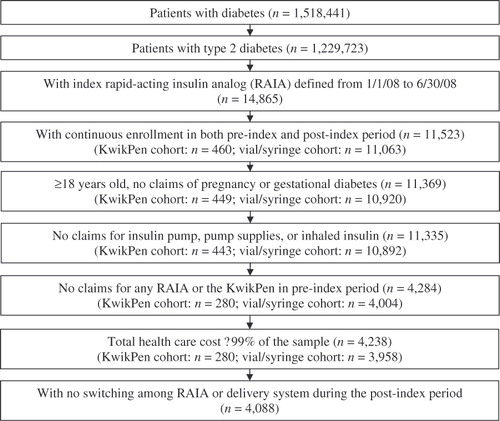
Table 2. Results of adherence and difference-in-difference (DID) analysis on resource utilization and hypoglycemia rate.
Table 3. Results of difference-in-difference (DID) analysis on cost.
Table 4. Results of post hoc analyses on diabetes-related pharmacy, outpatient, and inpatient cost breakdowns.
Supplemental material