Figures & data
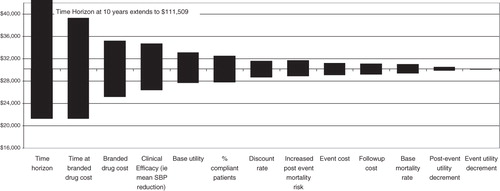
Figure 1. Hypertension and switching treatment Markov state diagram.
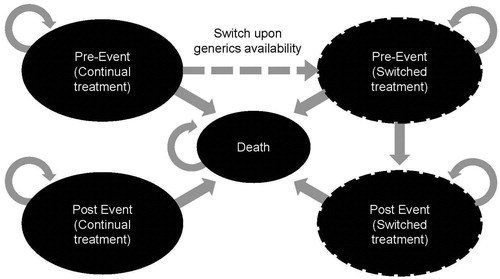
Table 1. Moderate hypertension model input values.
Table 2. Costs and outcomes of valsartan vs losartan and switching to losartan in moderate hypertension over 20 years.
Table 3. Incremental scenario analyses of valsartan vs losartan and vs switching in moderate hypertension patients.
Figure 2. Tornado chart of incremental cost per QALY gained: Valsartan vs switching to losartan.