Figures & data
Table 1. Baseline characteristics, medical history, and drug therapy during the follow-up.
Table 2. Bayesian estimates and the corresponding 95% confident intervals for the parameters of the bivariate regression models under censored and non-censored assumptions.
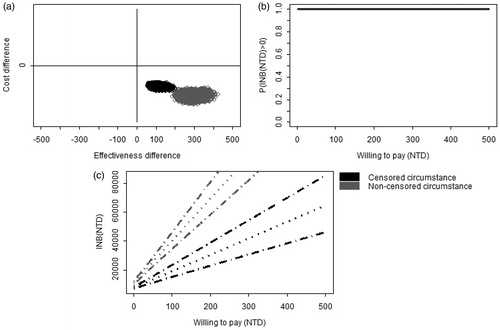
Figure 1. The comparison of cost-effectiveness between clopidogrel and aspirin. (a) Joint posterior sample of cost and effect differences on the CE plane. (b) Bayesian cost-effectiveness acceptability curve. The horizontal line indicated that posterior probability that INB is greater than zero is 0.5. (c) Bayesian 95% confidence intervals of INB (dashed lines) and the posterior means of INB (dotted lines).
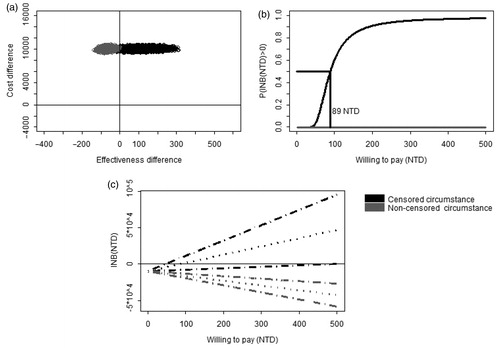
Figure 2. The comparison of cost-effectiveness between clopidogrel vs aspirin plus PPIs. (a) Joint posterior sample of cost and effect differences on the CE plane. (b) Bayesian cost-effectiveness acceptability curve. (c) Bayesian 95% confidence intervals of INB (dashed lines) and the posterior means of INB (dotted lines).
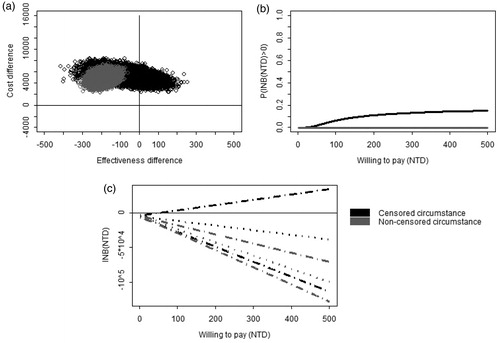
Figure 3. The comparison of cost-effectiveness between aspirin plus PPIs vs clopidogrel plus PPIs. (a) Joint posterior sample of cost and effect differences on the CE plane. (b) Bayesian cost-effectiveness acceptability curve. (c) Bayesian 95% confidence intervals of INB (dashed lines) and the posterior means of INB (dotted line).