Figures & data
Figure 1. Conceptual view of the Monte Carlo Micro-simulation (MCM) model. AE, treatment-emergent adverse event; EPS, extrapyramidal symptoms; Patient’s Treatment Status at the End of Quarter: C, Continue; D, Discontinue; S, Switch.
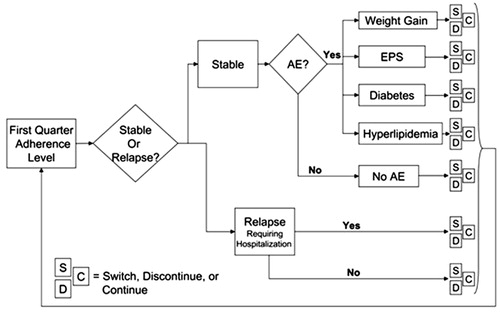
Table 1. Adherence rates by medication.
Table 2. Adherence rates by adherence level in cycle following relapse.
Table 3. Relapse rates requiring and not requiring hospitalization.
Table 4. Adjusted relapse rates given a history of relapse.
Table 5. Probability of multiple relapses within a single quarter.
Table 6. Probability of suicide event given adherence level.
Table 7. Treatment emergent adverse event values.
Table 8. Treatment discontinuation rates.
Table 9. Treatment switch patterns by reason for switching.
Table 10. Utility values for health states and disutility multipliers for treatment-emergent adverse events.
Table 11. Economic input parameters; medication costs.
Table 12. Economic input parameters: health service resource utilization.
Table 13. Economic input parameters: unit costs of health service resources.
Table 14. Economic input parameters: costs of adverse events.
Figure 2. Base case clinical outcomes: Relapse rates. ARIP, aripiprazole; ODT, orally disintegrating tablet [formulation]; OLZ, olanzapine; RIS, risperidone.
![Figure 2. Base case clinical outcomes: Relapse rates. ARIP, aripiprazole; ODT, orally disintegrating tablet [formulation]; OLZ, olanzapine; RIS, risperidone.](/cms/asset/74a5f3ad-316b-42dd-bb55-ae99052bcc9a/ijme_a_662923_f0002_b.jpg)
Figure 3. Base case clinical outcomes—Inpatient relapses. Mean number of inpatient relapses per patient. ARIP, aripiprazole; ODT, orally disintegrating tablet [formulation]; OLZ, olanzapine; RIS, risperidone.
![Figure 3. Base case clinical outcomes—Inpatient relapses. Mean number of inpatient relapses per patient. ARIP, aripiprazole; ODT, orally disintegrating tablet [formulation]; OLZ, olanzapine; RIS, risperidone.](/cms/asset/6204c810-9953-464e-a500-f8c4b81a411d/ijme_a_662923_f0003_b.jpg)
Figure 4. Base case clinical outcomes—Mean QALYs gained. ARIP, aripiprazole; ODT, orally disintegrating tablet [formulation]; OLZ, olanzapine; QALYs, quality-adjusted life years; RIS. risperidone.
![Figure 4. Base case clinical outcomes—Mean QALYs gained. ARIP, aripiprazole; ODT, orally disintegrating tablet [formulation]; OLZ, olanzapine; QALYs, quality-adjusted life years; RIS. risperidone.](/cms/asset/03e09d5f-c397-47db-af70-69d73832956e/ijme_a_662923_f0004_b.jpg)
Figure 5. Base case economic outcomes. ARIP, aripiprazole; ODT, orally disintegrating tablet [formulation]; OLZ, olanzapine; RIS, risperidone.
![Figure 5. Base case economic outcomes. ARIP, aripiprazole; ODT, orally disintegrating tablet [formulation]; OLZ, olanzapine; RIS, risperidone.](/cms/asset/90263d2e-e8b9-467d-a276-baffac3226b5/ijme_a_662923_f0005_b.jpg)
Table 15. Base case cost-effectiveness results.
Table 16. Base case relapse rates.
Table 17. One-way sensitivity analysis and QALY ICERs for ODT olanzapine vs olanzapine (standard oral tablet formulation).
Figure 6. Proportion of cohorts at or below selected ICER thresholds varying proportion of patients fully adherent. *The increase in full adherence for olanzapine ODT is assumed to come from the partially adherent patients. ICER, incremental cost-effectiveness ratios; ODT, orally disintegrating tablet [formulation]; OLZ, olanzapine.
![Figure 6. Proportion of cohorts at or below selected ICER thresholds varying proportion of patients fully adherent. *The increase in full adherence for olanzapine ODT is assumed to come from the partially adherent patients. ICER, incremental cost-effectiveness ratios; ODT, orally disintegrating tablet [formulation]; OLZ, olanzapine.](/cms/asset/2d5f08e7-d0bf-41a2-b5d0-0cb8ebee973f/ijme_a_662923_f0006_b.jpg)
Figure 7. Proportion of cohorts at or below selected ICER thresholds varying the absolute difference in annual discontinuation rate. ICER, incremental cost-effectiveness ratios; ODT, orally disintegrating tablet [formulation]; OLZ, olanzapine.
![Figure 7. Proportion of cohorts at or below selected ICER thresholds varying the absolute difference in annual discontinuation rate. ICER, incremental cost-effectiveness ratios; ODT, orally disintegrating tablet [formulation]; OLZ, olanzapine.](/cms/asset/2973ba23-a497-4878-b79a-f00cfe0717fd/ijme_a_662923_f0007_b.jpg)
Figure 8. Proportion of cohorts at or below selected ICER thresholds varying the relative risk of relapse. Relative risk (RR) is used to calculate ODT OLZ relapse rates relative to OLZ (ODT OLZ = RR * OLZ). ICER, incremental cost-effectiveness ratios; ODT, orally disintegrating tablet [formulation]; OLZ, olanzapine.
![Figure 8. Proportion of cohorts at or below selected ICER thresholds varying the relative risk of relapse. Relative risk (RR) is used to calculate ODT OLZ relapse rates relative to OLZ (ODT OLZ = RR * OLZ). ICER, incremental cost-effectiveness ratios; ODT, orally disintegrating tablet [formulation]; OLZ, olanzapine.](/cms/asset/661f108f-58ff-41bb-a645-4148e108ef1c/ijme_a_662923_f0008_b.jpg)