Figures & data
Figure 1. Model structure. SHPT: secondary hyperparathyroidism; CV: cardiovascular; PTH: parathyroid hormone; ![]()
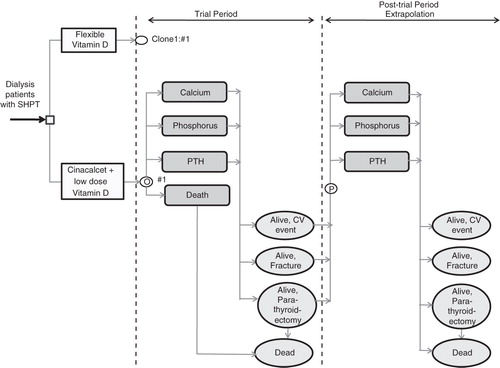
Table 1. Model inputs: Event rates.
Table 2. Model inputs: Costs and utility.
Figure 2. Tornado diagram (one-way and structural sensitivity analysis). CV: cardiovascular; PTH: parathyroid hormone; Ca: calcium; P: phosphorous; QALY: quality adjusted life year; USRDS: United States Renal Data System; Note: The base case is based on the Block variant. For one-way sensitivity analysis, the black (dark) bar indicates that the impact on ICER when model parameter is changed to a lower value and a grey (light) bar indicates impact on ICER when model parameter is changed to a higher value compared to the base case.
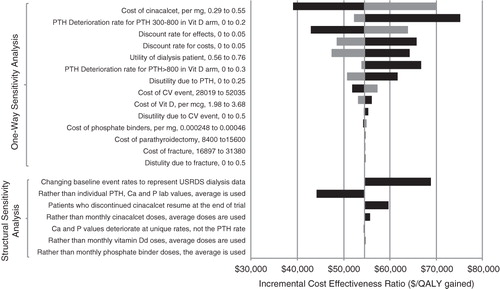
Table 3. Baseline model results (using various definitions of effectiveness).
Figure 3. Cost-effectiveness acceptability curve of cinacalcet vs vitamin D (costs without dialysis).
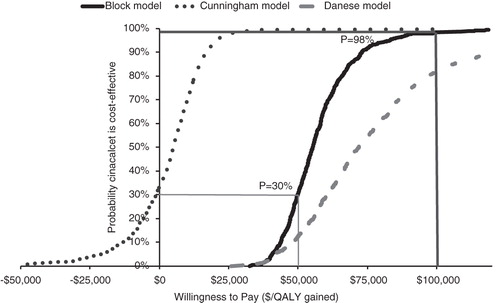
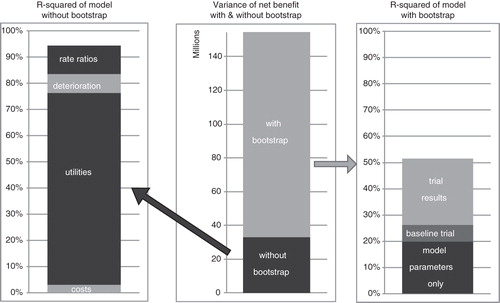
Figure 4. Probabilistic sensitivity analysis, explained variance at willingness to pay $100,000/QALY gained.