Figures & data
Figure 1. Decision tree model structure for the TIMES study treatment options. LUTS, lower urinary tract symptoms; OAB, overactive bladder; TAMS, tamsulosin; TOLT, tolterodine. *Model structure equal for all TIMES treatment options.
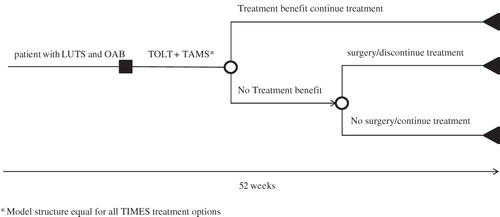
Table 1. Lower urinary tract symptoms at baseline and treatment effects after 12 weeks of drug treatment in the TIMES study used as model inputs.
Table 2. Estimated mean EQ-5D utility values over time, QALYs, and costs for alpha-blocker plus anti-muscarinic combination therapy compared with other TIMES study therapies.
Figure 2. Overview of the results of the univariate sensitivity analyses for tamsulosin plus tolterodine combination therapy vs tamsulosin monotherapy: Tornado graphs that present the impact on incremental effects (top) and incremental costs (bottom) when changing parameters within their outer limits of their 95% confidence intervals according to their uncertainty distributions (not all parameters are shown in these graphs). IPSS, International Prostate Symptom Score; NF, nighttime urinary frequency; TF, total 24-h urinary frequency; QALY, quality-adjusted life-year; UU, urinary urgency; UUI, urgency urinary incontinence.
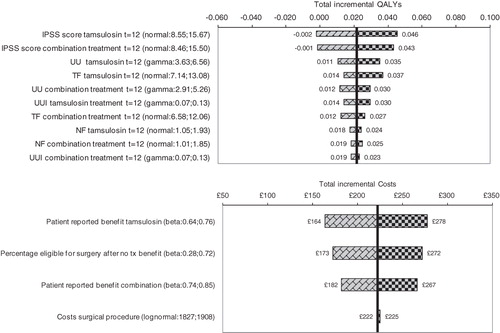
Figure 3. Results of the probabilistic sensitivity analysis of the three model comparisons. Top: Scatterplot representing uncertainty surrounding the central estimate of incremental costs and effects of tamsulosin plus tolterodine combination therapy vs its comparators. Bottom: Acceptability curves: estimated probability that a specific treatment strategy is cost-effective given different values of the willingness-to-pay (WTP) threshold. QALY, quality-adjusted life-year.
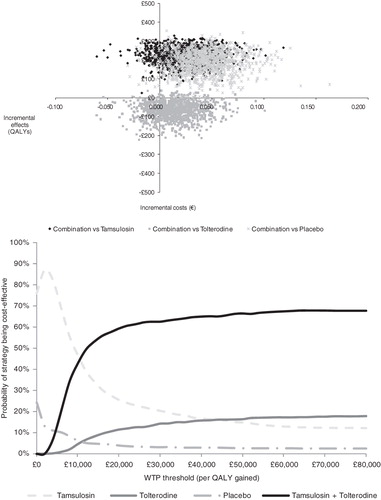
Figure 1. Graphical representation of the multinomial model. Patient symptoms profile is mapped to probabilities to give each specific answer on each separate question of the SF-12. Example for the first SF-12 question (general health) with five answering options.
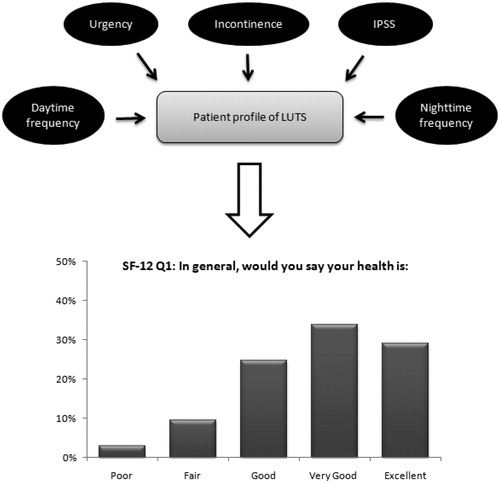
Table 1. Multinomial logistic regression model using questions on individual storage and voiding symptoms (column headers) from EpiLUTS as covariates for each SF-12 question (row headers).