Figures & data
Figure 1. Schematic representation of the Markov model. All patients start at age 37 years-old with RRMS and an EDSS score of 0–2.5. Patients can progress through different EDSS health states based on assigned transition probabilities over 10 years or until death (from MS or other causes). The transition probabilities depend on the EDSS stage the patient is in, as well as their prescribed therapy. Each cycle is 30 days in length. Patients can remain in an EDSS stage for more than one cycle. Patients may only enter the temporary health state of relapse while in EDSS 0–2.5 or EDSS 3–5.5. Once patients enter EDSS 6–7.5 or higher, they are considered to have SPMS and their disease modifying drug is discontinued. All patients are assumed to receive basic supportive care. ‘M’ represents a Markov process. EDSS, Expanded Disability Status Scale; IFN, interferon; RRMS, relapse–remitting multiple sclerosis; SPMS, secondary-progressive multiple sclerosis; Tx, treatment.
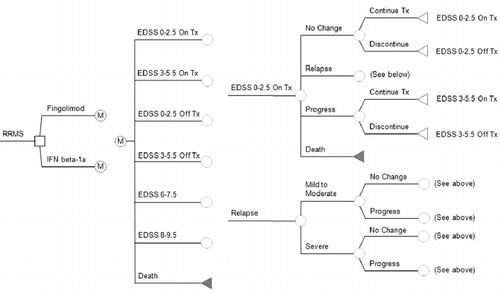
Table 1. Base-case model variables and ranges used in sensitivity analysis.
Table 2. Base-case analysis results.
Figure 2. Tornado diagram of one-way sensitivity analysis. Each bar indicates the range of cost per additional QALY saved with fingolimod compared to IFN beta-1a as determined in one-way sensitivity analysis over a priori plausible ranges for each variable. The upper and lower limits of each value used in the sensitivity analysis are listed next to each bar. The dotted line represents the ICER determined from the base-case analysis ($73,975 per QALY). ICER, incremental cost-effectiveness ratio; IFN, interferon; QALY, quality-adjusted life year.
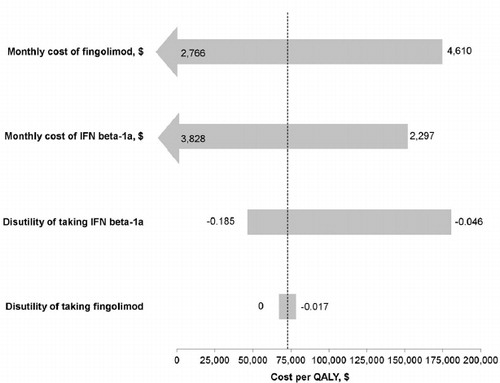
Figure 3. Effect of time horizon on the incremental cost-effectiveness ratio. This diagram portrays the varying effect of time horizon on the incremental cost-effectiveness of fingolimod. QALY, quality-adjusted life year.
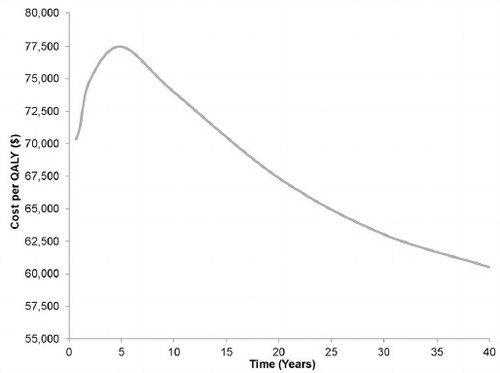
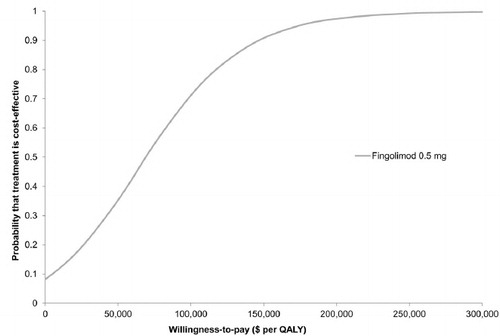
Figure 4. Results of Monte Carlo simulation. Cost-effectiveness acceptability curve based on 10,000 iterations, which drew parameters for each input simultaneously from probability distributions. Fingolimod was found to be cost-effective compared to IFN beta-1a in 35% and 70% of the simulations at willingness-to-pay thresholds of $50,000 and $100,000 per QALY, respectively. IFN, interferon; QALY, quality-adjusted life year.