Figures & data
Figure 1. A comparison of the MI risk benefit of the statin models with real-world clinical trial results plotted against percent change in LDL. The models of atorvastatin 10 mg, 40 mg, and 80 mg are labeled A 10 mg, A 40 mg, and A 80 mg, respectively.
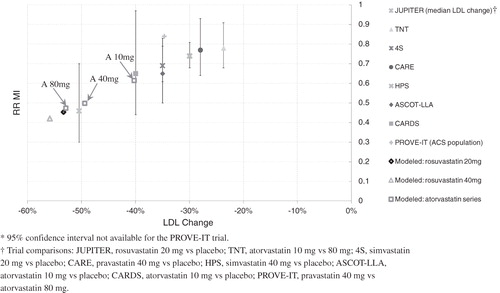
Figure 2. A comparison of the stroke risk benefit of statin models with real-world trial results plotted against percent change in LDL.
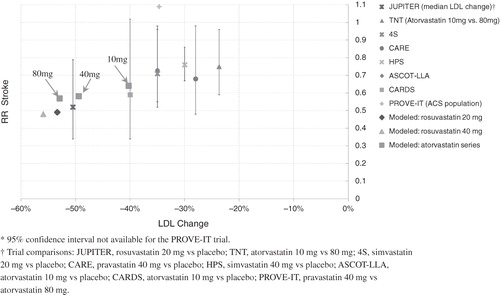
Table 1. Results from the trial validations used to confirm the treatment models. The hazard ratio from the trial is compared to the relative risk from the simulation.
Table 2. Baseline characteristics of the FRS ≥ 5% population, embedded sub-populations defined by baseline disease history and risk score stratifications, and ACS population. Values are means (standard deviation) unless indicated as percentages. For the ACS population, disease history does not include the qualifying index event.
Table 3. Percentage reduction in mean TC/HDL ratio and LDL for the full FRS ≥ 5% population at year 1, based on the simulation compared to the STELLAR trial. Larger values indicate greater efficacy.
Figure 3. The Kaplan-Meier cumulative incidence of MACE in the FRS ≥ 5% population. The solid and dashed lines correspond to the rosuvastatin 20 mg and 40 mg arms, respectively. The open squares and solid circles correspond to the atorvastatin 40 mg and 80 arms, respectively. MACE was defined as the first occurrence of MI, stroke, or cardiovascular death.
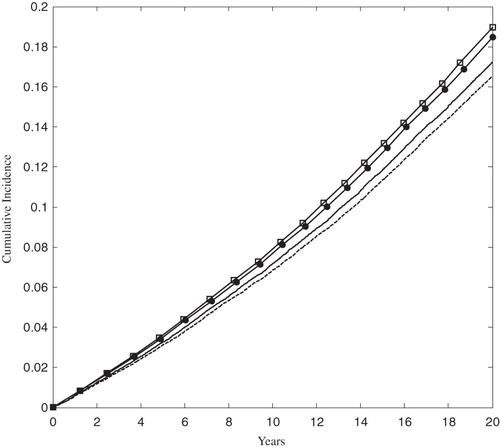
Figure 4. The Kaplan-Meier cumulative incidence of MACE in the ACS population. The solid and dashed lines correspond to the rosuvastatin 20 mg and 40 mg arms, respectively. The open squares and solid circles correspond to the atorvastatin 40 mg and 80 arms, respectively. MACE was defined as the first occurrence of MI, stroke, or cardiovascular death.
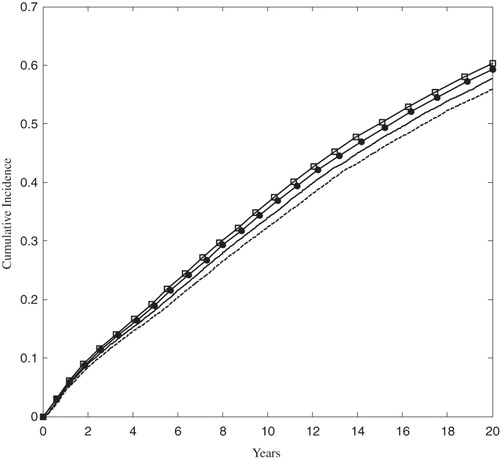
Figure 5. The relative risk of MACE provided treatment with rosuvastatin 20 mg vs atorvastatin 40 mg, for each population, at 5 and 20 years. The size of each black square is approximately proportionate to the number of patients who had a MACE event in the sub-group; the horizontal lines indicate 95% confidence intervals. A number less than 1 is favorable to rosuvastatin 20 mg.
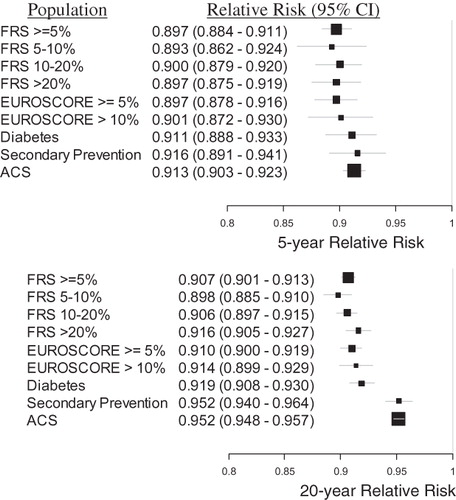
Figure 6. The relative risk of MACE provided treatment with rosuvastatin 40 mg vs atorvastatin 80 mg, for each population, at 5 and 20 years. The size of each black square is approximately proportionate to the number of patients who had a MACE event in the sub-group; the horizontal lines indicate 95% confidence intervals. A number less than 1 is favorable to rosuvastatin 40 mg.
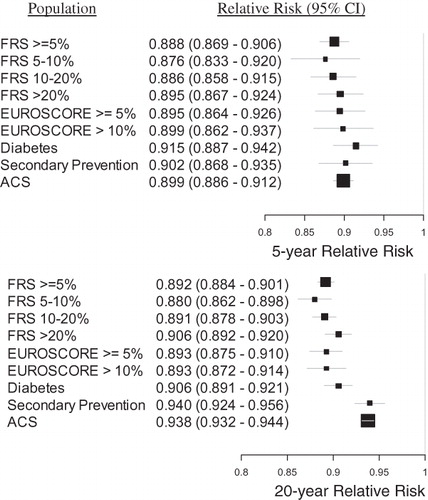
Figure 7. The number needed to treat to prevent one MACE event at 5 years by treatment with rosuvastatin relative to atorvastatin, according to baseline population. Smaller positive values indicate greater benefit due to treatment with rosuvastatin.
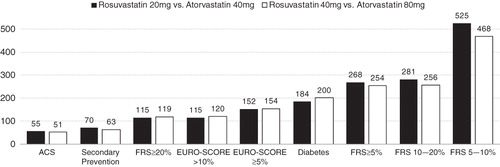
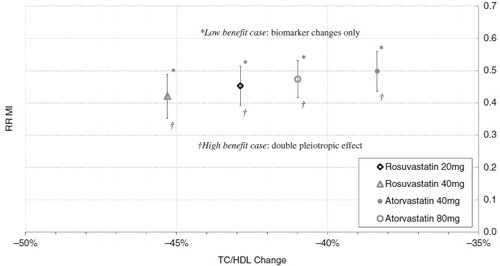
Figure 8. Sensitivity analysis showing the response of RR of MI to removing (low benefit case) and doubling (high benefit case) the pleiotropic effect.