Figures & data
Table 1. Overview of resource use and costs related to drug administration and monitoring of fingolimod (cost year 2011).
Table 2. Overview of resource use and costs related to drug administration and monitoring of natalizumab (cost year 2011).
Figure 1. Cost items for fingolimod. The pre-treatment, monitoring and additional safety monitoring items are included in the cost estimation. VZV: Varicella Zoster Virus, i.e. virus causing chicken pox.
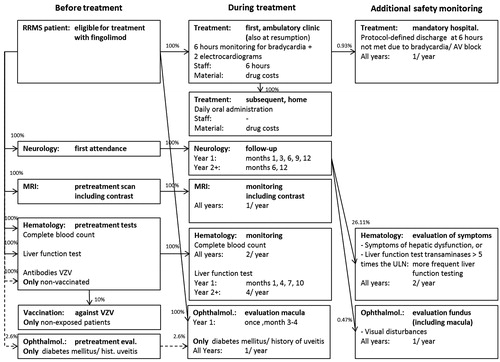
Figure 2. Cost items natalizumab. The pre-treatment and monitoring items are included in the cost estimation. The additional safety monitoring items are conservatively not included in the cost estimation. PML, Progressive Multifocal Leukoencephalopathy.
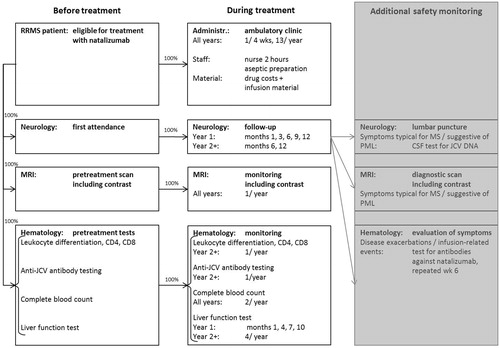
Table 3. Total discounted costs and incremental analyses including predicted 95% confidence intervals (CIs) after 1, 2, 5, and 10 patient years of treatment, respectively.
Table 4. Discounted cost estimates per cost category over a 2-year time horizon.
Figure 3. Overview of the 2-year results of the conducted deterministic univariate sensitivity analyses of fingolimod vs natalizumab. The bars in the tornado graph represent the impact on incremental costs when varying each parameter between the outer limits of their 95% CIs. The costs for a daycare visit both represent the costs of the first administration of fingolimod and the costs of each administration of natalizumab. Only the 15 most influential parameters are displayed.
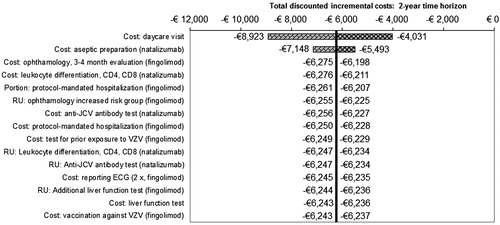
Table 5. Discounted incremental costs after 1, 2, 5, and 10 years: base case, worst case, and best case scenario.