Figures & data
Table 1. Attributes and levels with descriptions for the choice questions.
Figure 1. Example of a choice question. Patients could click on the label to see the description for any medication feature. Prior to answering the choice questions, patients were asked to assume that (1) their RCC was metastatic, (2) they were starting a new medication, (3) this was the last medication they could take, and (4) all of their medical bills, including the cost of medications, were covered by health insurance. RCC = renal cell carcinoma.
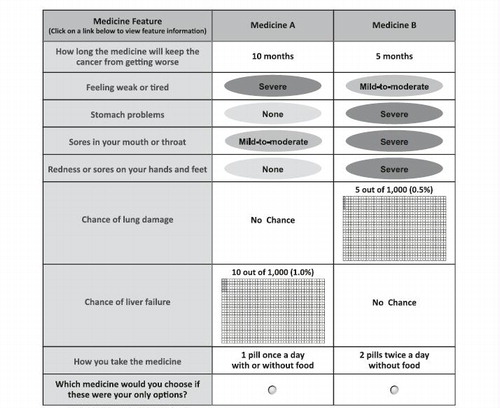
Table 2. Demographics and baseline characteristics of the sample.
Figure 2. Preference weight graph. Preference weights for the eight attributes. Only relative differences matter when interpreting preference weights. The differences between adjacent weights indicate the relative importance of moving from one level of an attribute to an adjacent level of that attribute. The vertical distance between the best and worst level (that is, difference in the model coefficients) of each attribute is a measure of the overall mean relative importance of that attribute (over the ranges presented in the survey) to patients. The vertical bars surrounding each mean preference weight denote the 95% confidence intervals about the point estimate. If the confidence intervals do not overlap for adjacent levels in a particular attribute, the mean estimates are statistically different from each other at the 5% level of significance.
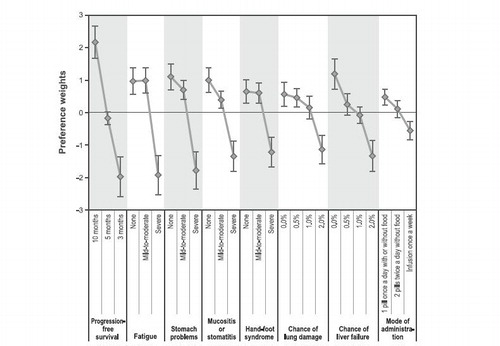
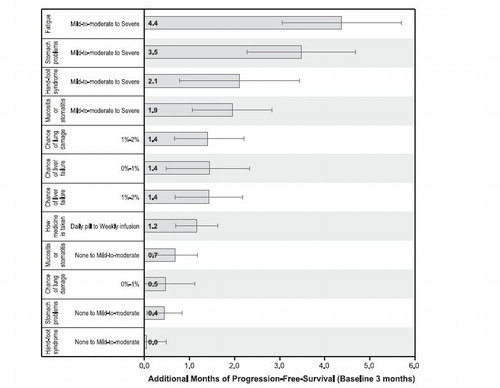
Figure 3. Benefit equivalents. Benefit equivalents, as measured in months of progression-free survival, are measures of the relative importance of changes in toxicities that patients generally were willing to accept in exchange for accepting adverse events of varying severities. The horizontal bars surrounding each benefit equivalent denote the 95% confidence intervals about the point estimate. If the confidence intervals do not overlap for two benefit equivalents, the mean estimates are statistically different from each other at the 5% level of significance. The confidence intervals were estimated using the Krinsky-Robb procedure of 10,000 draws by dividing the difference in the preference weights of interest (e.g., an improvement in fatigue from ‘mild-to-moderate’ to ‘none’) by the relevant preference weight interval for progression-free survival.