Figures & data
Table 1. Attributes and levels for the choice questions.
Figure 1. Example choice question (patient version).
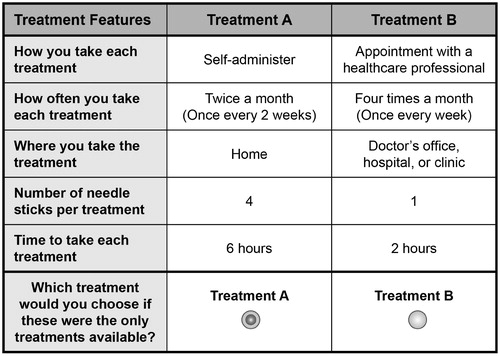
Figure 2. Preference weights: Patients (n = 252) and parents (n = 66). The vertical bars surrounding each mean importance estimate denote the 95% confidence interval about the point estimate. If the confidence intervals do not overlap for adjacent levels in a particular attribute, the mean estimates are statistically different from each other at the 5% level of significance. Preference weights for the five attributes for patients and parents. Only relative differences matter when interpreting preference weights. The differences between adjacent weights indicate the relative importance of moving from one level of an attribute to an adjacent level of that attribute. The vertical distance between the best and worst level (that is, difference in the model coefficients) of each attribute is a measure of the overall mean relative importance of that attribute (over the ranges presented in the survey) to respondents.
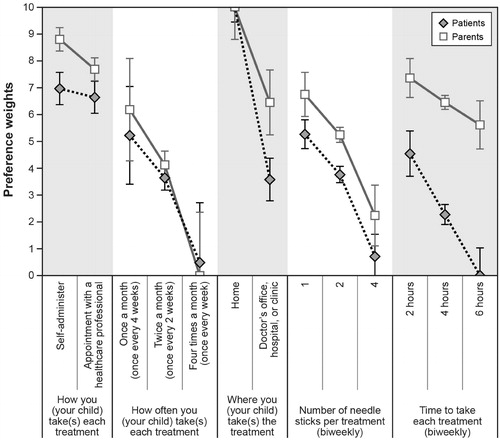
Table 2. Demographics and baseline characteristics of the sample.