Figures & data
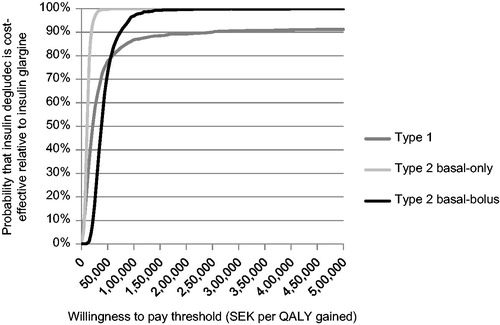
Figure 1. Overview of the cost-utility model. HRQoL, health-related quality-of-life; Hypo, hypoglycemia; ICER, incremental cost-effectiveness ratio; IDeg, insulin degludec; IGlar, insulin glargine; QALY, quality-adjusted life year; SMBG, self-monitored blood glucose.
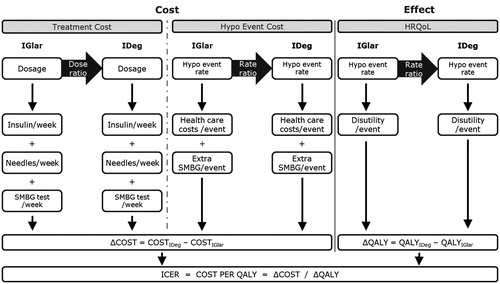
Table 1. Incidence of hypoglycemia in patients receiving insulin glargine and the rate ratio applied in the degludec arm.
Table 2. Basal and bolus insulin use in patients receiving degludec and glargine.
Table 3. Unit costs used in the analysis.
Table 4. Mean direct and indirect cost of hypoglycemic events.
Table 5. Utilities and disutilities used in the modeling analysis.
Table 6. Base case results.
Table 7. Results of sensitivity analyses.
Figure 2. Cost-effectiveness scatterplot for degludec vs glargine in patients with type 1 diabetes, patients with type 2 diabetes receiving basal-only therapy, and patients with type 2 diabetes receiving basal-bolus therapy. Incremental costs are expressed in SEK and incremental effectiveness in QALYs. Each point represents a run of the model (with sampling from distributions) from a total of 1000 simulations. QALY, quality-adjusted life years; SEK, 2012 Swedish Krona.
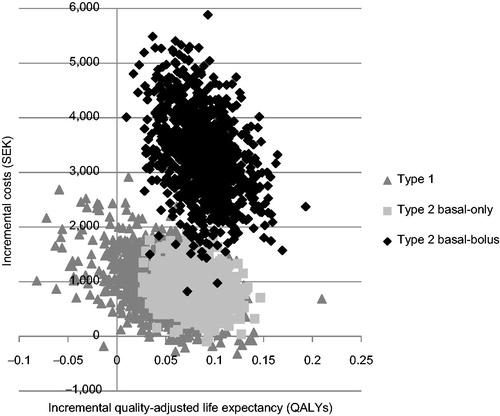
Figure 3. Cost-effectiveness acceptability curves for degludec vs glargine in patients with type 1 diabetes, patients with type 2 diabetes receiving basal-only therapy, and patients with type 2 diabetes receiving basal-bolus therapy. The curve represents the proportion of 1000 points (see ) associated with incremental cost-effectiveness ratios lower (and therefore considered cost-effective) than the range of willingness-to-pay thresholds described on the x-axis. QALY, quality-adjusted life years; SEK, 2012 Swedish Krona.