Figures & data
Table 1. Patient selection and attrition reasons.
Table 2. Demographics.
Table 3. Clinical characteristics.
Figure 1. Treatment effectiveness over 2 years of follow-up.
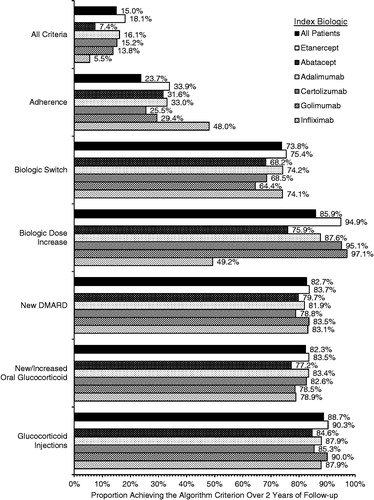
Table 4. Treatment failures and response duration.
Figure 2. Mean (+SD) RA-related healthcare costs over 2 years of follow-up. Includes medical and pharmacy claims with a primary diagnosis of RA (ICD 714.0x).
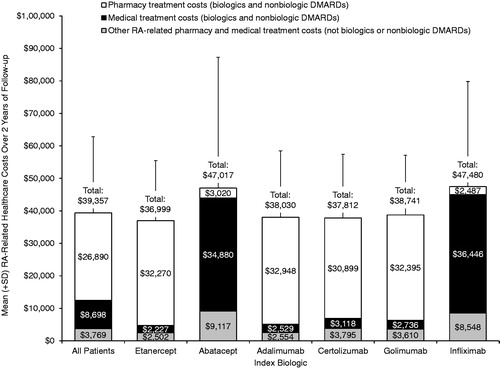
Table 5. Mean (±SD) biologic costs over 2 years of follow-up.
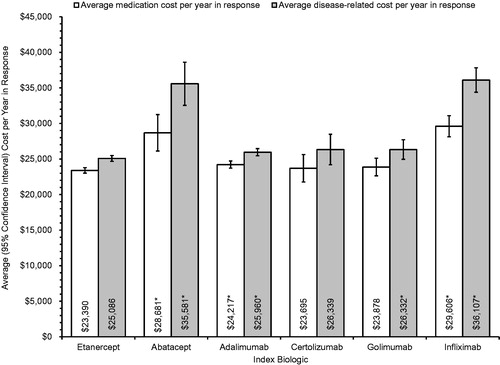
Figure 3. Average (+95% CI) cost per patient-year in response by index biologic. *p < 0.05 vs etanercept.