
Figures & data
Table 1. Demographic and clinical characteristics, overall and by average pain severity*.
Figure 1. Brief Pain Inventory–Short Form (BPI-SF) Pain Interference Index scores stratified by BPI-SF average pain severity score (mild = 0–3, moderate = 4–6, and severe = 7–10). One subject did not respond to all required items needed to calculate an average pain severity score and thus was not included in any analysis by pain severity. The BPI-SF Pain Interference Index scored on a 0–10 scale. p < 0.0001 across pain severity groups.
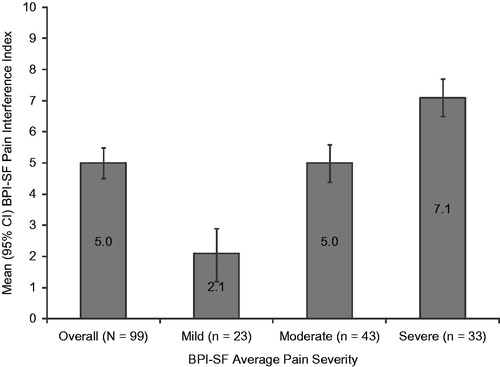
Table 2. Patient-reported pain interference with function, physical and mental health status, and sleep, by average pain severity*.
Figure 2. Summary scale scores on the 12 item Short Form Health Survey stratified by Brief Pain Inventory–Short Form (BPI-SF) average pain severity score (mild = 0–3, moderate = 4–6, and severe = 7–10). One subject did not respond to all required items needed to calculate an average pain severity score and thus was not included in any analysis by pain severity. Summary scores are scored on a 0–100 scale (higher scores indicate better health status); population norms are indicated by the broken horizontal line. Physical Component Summary: p < 0.0001 and Mental Component Summary: p = 0.0010 across pain severity groups.
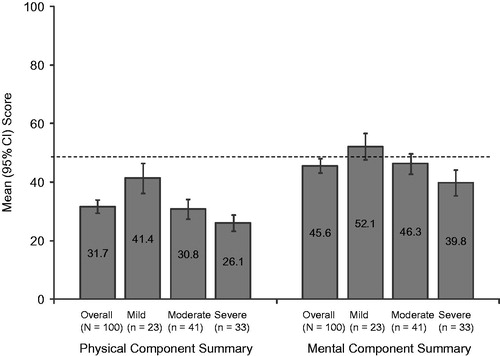
Figure 3. EuroQol health state utility scores stratified by Brief Pain Inventory–Short Form (BPI-SF) average pain severity score (mild = 0–3, moderate = 4–6, and severe = 7–10). One subject did not respond to all required items needed to calculate an average pain severity score and thus was not included in any analysis by pain severity. EuroQol is scored on a −0.11 to 1.00 scale (higher scores indicate better health status); population norm is indicated by the broken horizontal line. p < 0.0001 across pain severity groups.
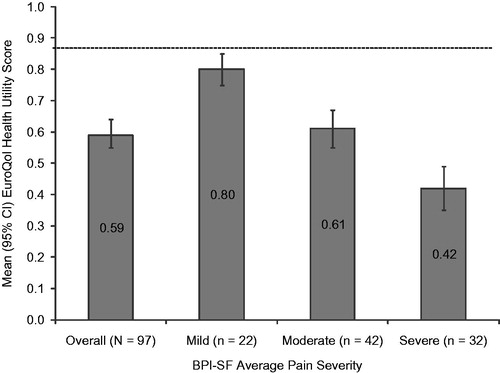
Figure 4. Medical Outcomes Study Sleep Scale (MOS-SS) Sleep Problems Index score stratified by Brief Pain Inventory–Short Form (BPI-SF) average pain severity score (mild = 0–3, moderate = 4–6, and severe = 7–10). One subject did not respond to all required items needed to calculate an average pain severity score and thus was not included in any analysis by pain severity. The MOS-SS Sleep Problems Index is scored on a 0–100 scale (higher score indicates greater sleep problems); population norm is indicated by the broken horizontal line. p < 0.0001 across pain severity groups.
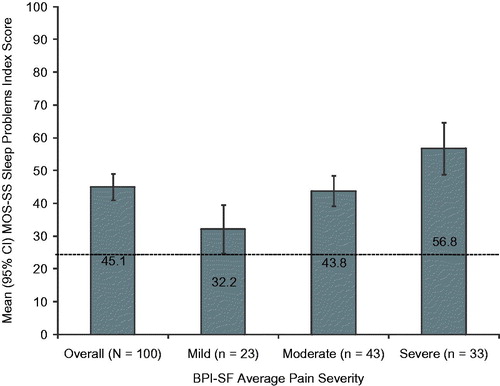
Figure 5. Overall employment status among the study subjects (N = 100). Employment status differed significantly by pain severity (p = 0.0138), with 26.1% of mild, 20.9% of moderate, and 3.0% of severe subjects employed for pay; 4.3% of mild, 18.6% of moderate, and 42.4% of severe subjects disabled; 56.5% of mild, 48.8% of moderate, and 42.4% of severe subjects retired; and 8.7% of mild, 7.0% of moderate, and 6.1% of severe subjects unemployed. Two moderate subjects and one severe subject selected ‘other’, and one mild subject and one severe subject had missing data.
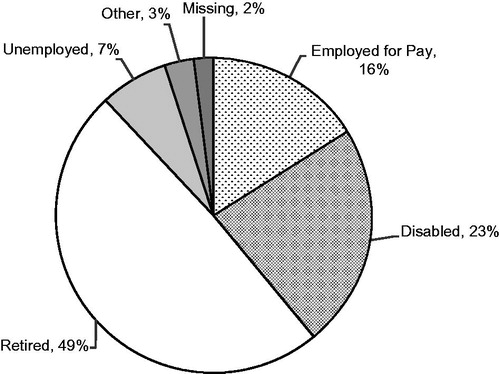
Table 3. Impact on employment status, work productivity, and activity impairment due to small fiber neuropathy, overall and by average pain severity*.
Table 4. Healthcare resource utilization for small fiber neuropathy, overall and by average pain severity*.
Figure 6. Pain-related medications prescribed for small fiber neuropathy (N = 100). Figure includes all reported classes with ≥2% of subjects prescribed one or more medications in the class. Opioids (all) include strong short-acting opioids, long-acting opioids, and weak short-acting opioids. NSAIDs, nonsteroidal antiinflammatory drugs; SNRIs, serotonin–norepinephrine reuptake inhibitors; TCAs, tricyclic antidepressants.
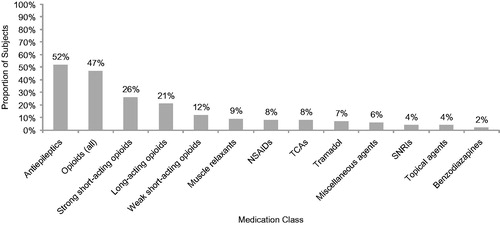
Table 5. Annual per-patient direct, indirect, and total costs, overall and by average pain severity*.
Figure 7. Mean adjusted annualized direct and indirect costs stratified by Brief Pain Inventory–Short Form (BPI-SF) average pain severity score (mild = 0–3; moderate = 4–6; and severe = 7–10). One subject did not respond to all required items needed to calculate an average pain severity score and thus was not included in any analysis by pain severity. p < 0.0001 across pain severity groups for both direct and indirect costs. Values are least squares mean estimates from multiple linear regression adjusted for confounding demographic and clinical variables. Specifically, covariates for direct costs: pain severity (mild/moderate/severe only) and comorbidities (headache/migraine, fibromyalgia [mild/moderate/severe only], restless leg syndrome, anxiety, other); and for indirect costs: age, pain severity (mild/moderate/severe only), workers’ compensation, employment status (overall only), and comorbidities (headache/migraine, Raynaud’s syndrome, other).
![Figure 7. Mean adjusted annualized direct and indirect costs stratified by Brief Pain Inventory–Short Form (BPI-SF) average pain severity score (mild = 0–3; moderate = 4–6; and severe = 7–10). One subject did not respond to all required items needed to calculate an average pain severity score and thus was not included in any analysis by pain severity. p < 0.0001 across pain severity groups for both direct and indirect costs. Values are least squares mean estimates from multiple linear regression adjusted for confounding demographic and clinical variables. Specifically, covariates for direct costs: pain severity (mild/moderate/severe only) and comorbidities (headache/migraine, fibromyalgia [mild/moderate/severe only], restless leg syndrome, anxiety, other); and for indirect costs: age, pain severity (mild/moderate/severe only), workers’ compensation, employment status (overall only), and comorbidities (headache/migraine, Raynaud’s syndrome, other).](/cms/asset/8b527319-09f1-4fb4-ad05-55f6ad557e4d/ijme_a_909439_f0007_b.jpg)
Table 6. Model coefficients for adjusted annual costs.