Figures & data
Figure 1. Economic model health states and transitions.
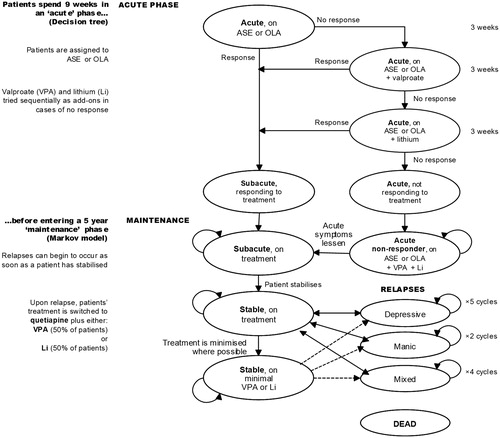
Table 1. Clinical input data for acute and maintenance phases.
Table 2. Relapse episode duration and length of associated inpatient stay in patients admitted to hospital.
Table 3. Utility values.
Table 4. Drug dosages, acquisition, and monitoring costs.
Table 5. Healthcare resources consumed (source: Soares-Weiser et al.Citation32).
Table 6. Adverse event (weight gain and EPS) costs.
Table 7. Base case analysis results (5 years and 9 weeks).
Figure 2. Results of deterministic sensitivity analyses in a tornado diagram.
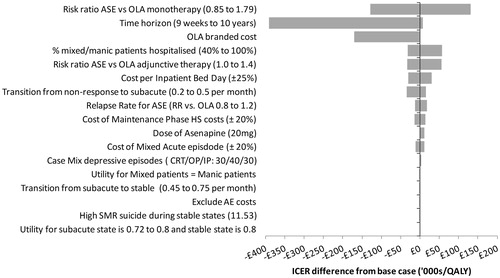
Figure 3. Cost-effectiveness acceptability curve for treatment with ASE vs OLA.
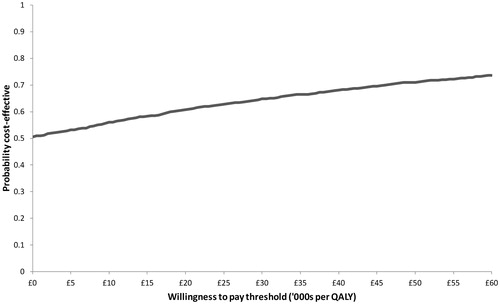
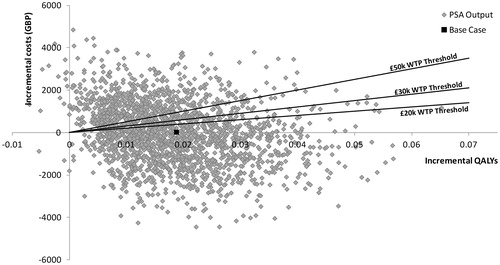
Figure 4. PSA scatterplot on cost-effectiveness plane for asenapine vs olanzapine.