Figures & data
Table 2. Treatment effects from clinical trials and assumptions applied in the model based analysis.
Table 3. Base case analysis liraglutide 1.2 mg vs SU as add-on to metformin. Results by gender and smoking status. Discounted QALYs and discounted costs in SEK 2013.
Table 4. Base case analysis liraglutide 1.2 mg vs sitagliptin as an add-on to metformin. Results by gender and smoking status. Discounted QALYs and discounted costs in SEK 2013.
Table 5. Base case analysis liraglutide 1.2 mg vs SU as an add-on to metformin. Results for non-smoking men. Discounted costs in SEK 2013 by source of cost.
Table 6. Base case analysis liraglutide 1.2 mg vs sitagliptin as an add-on to metformin. Results for non-smoking men. Discounted costs in SEK 2013 by source of cost.
Table 7. Three sensitivity analyses for liraglutide 1.2 mg vs SU as an add-on to metformin. Discounted life years, QALYs and costs in SEK. Results for non-smoking men.
Table 8. Three sensitivity analyses for liraglutide 1.2 mg vs sitagliptin as an add-on to metformin. Discounted life years, QALYs and costs in SEK. Results for non-smoking men.
Figure 1. Cost-effectiveness plane for liraglutide 1.2 mg vs sulphonylurea as an add-on to metformin. PSA with 500 simulations. Base case, 3% discount rate.
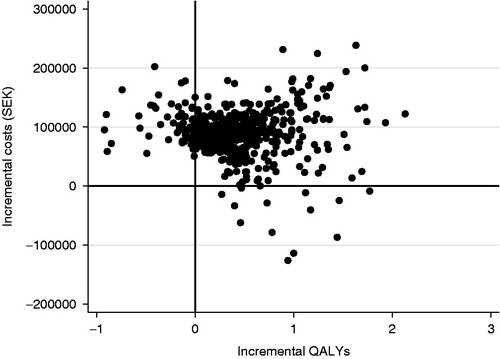
Figure 2. Cost-effectiveness acceptability curve of liraglutide 1.2 mg vs sulphonylurea. PSA with 500 simulations. Base case, 3% discount rate.
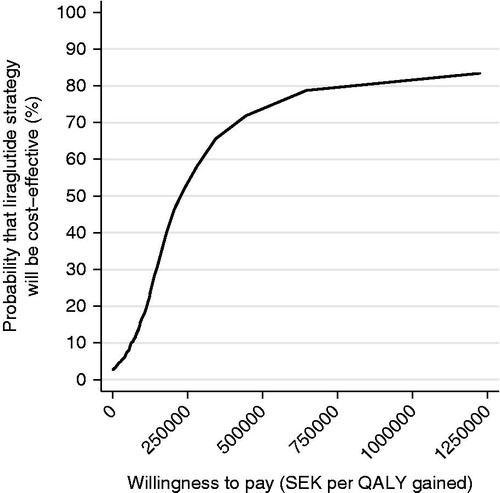
Figure 3. Cost-effectiveness plane for liraglutide 1.2 mg vs sitagliptin 100 mg as an add-on to metformin. PSA with 500 simulations. Base case, 3% discount rate.
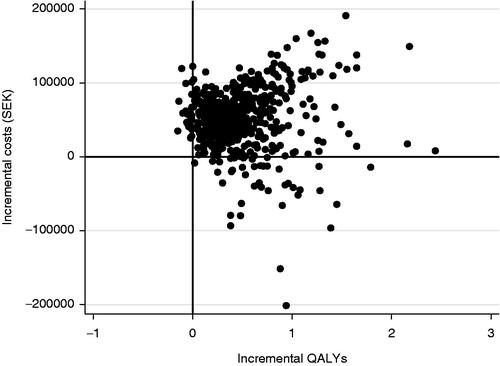
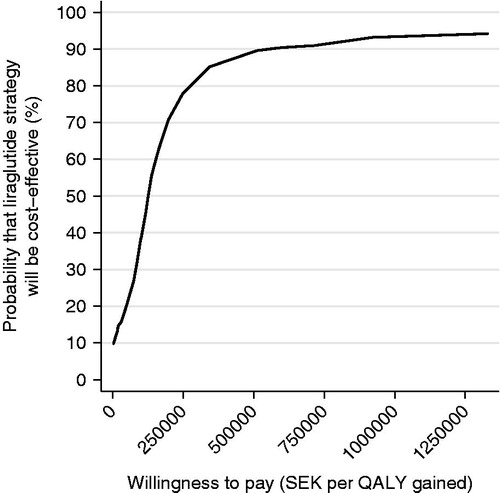
Figure 4. Cost-effectiveness acceptability curve of liraglutide 1.2 mg vs sitagliptin 100 mg. PSA with 500 simulations. Base case, 3% discount rate.