Figures & data
Table 1. Patient demographics.
Table 2. Patient baseline clinical characteristics.
Figure 1. Patient selection diagram. BID = twice daily; GLP-1RA = glucagon-like peptide-1 receptor agonist; QW = once weekly.
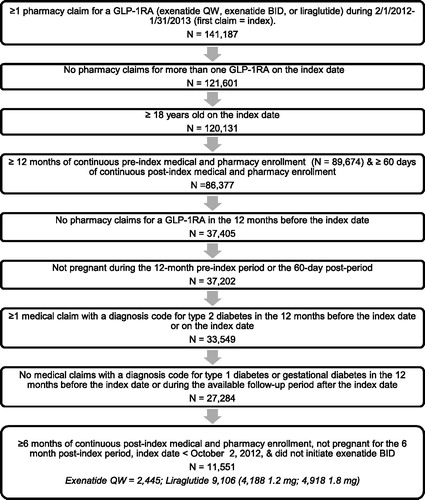
Table 3. Unadjusted overall healthcare utilization during 6 month follow-up period.
Table 4. Unadjusted overall healthcare costs during 6 month follow-up period.
Figure 2. Multivariable logistic regression-adjusted odds of overall inpatient admission during 6 month follow-up period, exenatide QW as reference category (N = 11,551). CI = confidence interval; QW = once weekly.
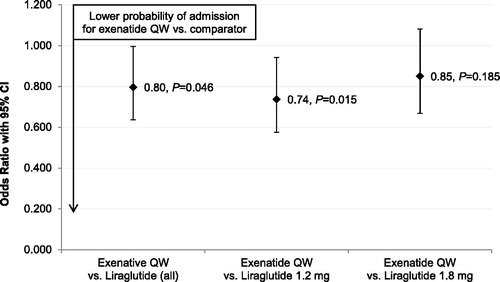
Figure 3. Multivariable regression-adjusted overall total healthcare costs during 6 month follow-up period (N = 11,551). QW = once weekly.
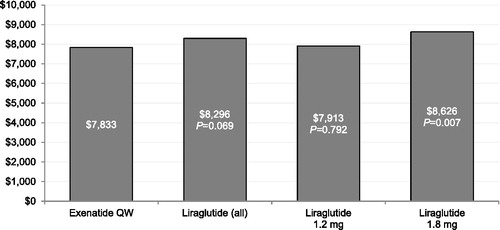
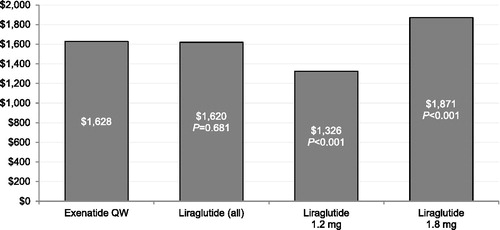
Figure 4. Multivariable regression-adjusted overall medical costs during 6 month follow-up period (N = 11,551). QW = once weekly.
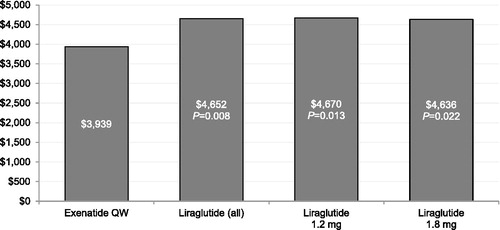
Table 5. Unadjusted diabetes-specific healthcare utilization during 6 month follow-up period.
Table 6. Unadjusted diabetes-specific healthcare costs during 6 month follow-up period.
Figure 5. Multivariable logistic regression-adjusted odds of diabetes-specific inpatient admission during 6 month follow-up period, exenatide QW as reference category (N = 11,551). CI = confidence interval; QW = once weekly.
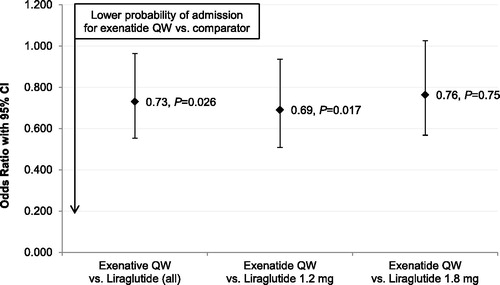
Figure 6. Multivariable regression-adjusted diabetes-specific total costs during 6 month follow-up period (N = 11,551). QW = once weekly.
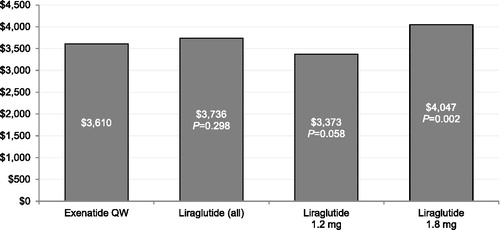
Figure 7. Multivariable regression-adjusted diabetes-specific medical costs during 6 month follow-up period (N = 11,551). QW = once weekly.
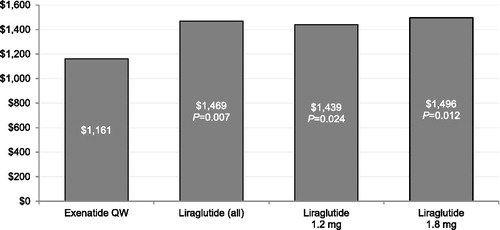
Figure 8. Multivariable regression-adjusted GLP-1RA costs during 6 month follow-up period (N = 11,551). GLP-1RA = glucagon-like peptide-1 receptor agonist; QW = once weekly.