Figures & data
Figure 1. Markov model schematic for chronic hepatitis C. Patients can die in each health state. The grey health state ‘excess mortality’ represents the disease-specific mortality associated with having DCC, LT or HCC. Dashed arrows represent health state transitions only investigated in sensitivity analysis. DCC, Decompensated cirrhosis; HCC, Hepatocellular carcinoma; LT, Liver transplant; SVR, Sustained virological response.
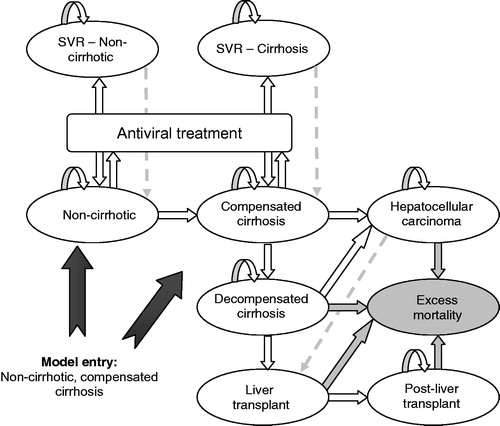
Table 1. SVR by indication.
Table 2. Transition probabilities.
Table 3. Summary of results per indication for a mixed cohort.
Table 4. Summary of results per indication for a cirrhotic cohort.
Figure 2. Cost-effectiveness acceptability curves by patient population and comparator regimen.
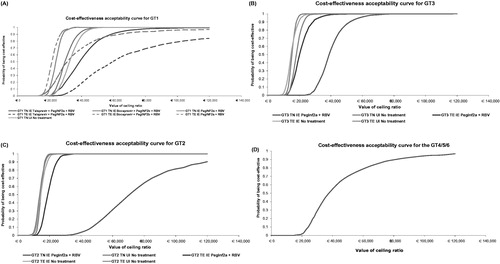
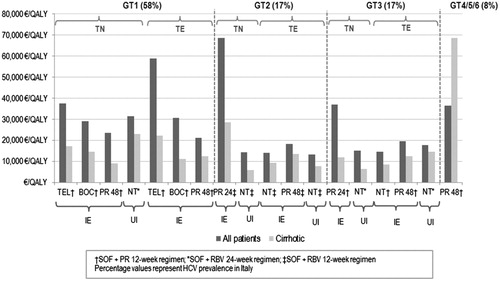
Figure 3. ICERs by patient population versus HCV prevalence by genotype. TEL, Telaprevir; BOC, Boceprevir; PR, Peginterferon alfa + ribavirin; NT, No treatment; IE, Interferon eligible; UI, Unsuitable for interferon; SOF, Sofosbuvir; RBV, Ribavirin; HCV, Hepatitis C virus.