Figures & data
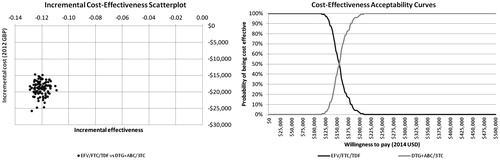
Figure 1. Model flow diagram. AE, Adverse event; Tx, Treatment.
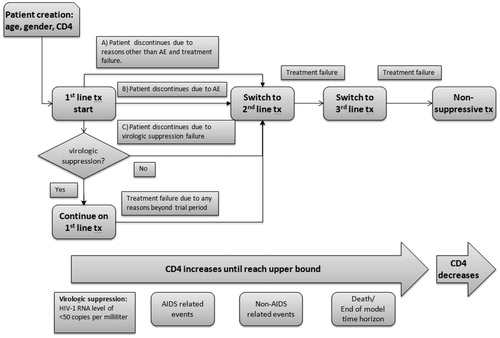
Table 1. Clinical inputs.
Figure 2. Time to virologic suppression on first-line treatmentCitation7.
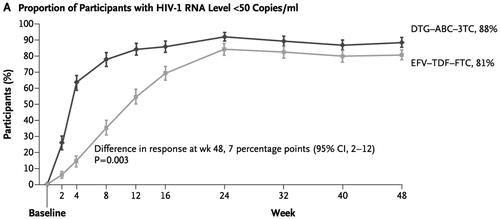
Table 2. Risks of clinical, adverse, and mortality events.
Table 3. Utility inputs.
Table 4. Cost inputs.
Table 5. Base-case results.
Figure 3. Base case results presented as net monetary benefit analysis. The two lines representing EFV/TDF/FTC and DTG + ABC/3TC are nearly parallel (indicating that the efficacy benefit of the two treatments is nearly identical), with the EFV/TDF/FTC line remaining very slightly higher, indicating it is marginally more cost-effective.
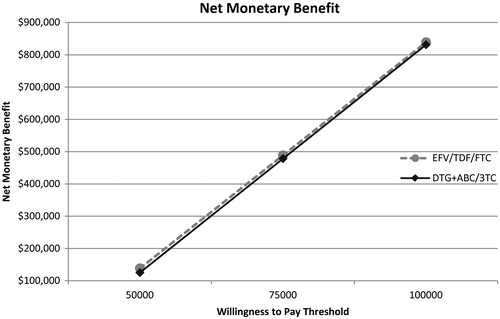
Table 6. Results of one-way sensitivity scenarios (EFV/TDF/FTC vs DTG/ABC/3TC).
Figure 4. Incremental cost-effectiveness scatterplot and cost-effectiveness acceptability curves. In the scatterplot, the tight grouping of points indicates model results are robust to variations in parameter values and that EFV/TDF/FTC is consistently cost-saving with a slightly lower incremental health benefit. This is mirrored in the cost-effectiveness acceptability curve, which shows EFV/TDF/FTC to have a 100% probability of being cost-effective compared to DTG + ABC/3TC at accepted willingness-to-pay thresholds.